7. 관찰 가능성 Observability: Understanding the behavior of your services
※ 다음 4가지를 중점으로 실습과 개념을 정리 합니다.
- 기본적인 요청 수준 메트릭 수집하기 Collecting basic request-level metrics
- 이스티오의 서비스 간 표준 메트릭 이해하기 Understanding Istio’s standard service-to-service metrics
- 프로메테우스로 워크로드 및 컨트롤 플레인 메트릭 긁어오기 Using Prometheus to scrape workload and control-plane metrics
- 이스티오에 프로메테우스에서 추적할 새 메트릭 추가하기 Adding new metrics in Istio to track in Prometheus
관찰 가능성(Observability)이 왜 중요한가?
- Observability는 최근 소프트웨어 개발, 운영, SRE 팀 사이에서 점점 중요해지고 있다.
- 클라우드 환경에서 마이크로서비스가 보편화되면서 복잡성은 기하급수적으로 증가한다.
- 수십~수백 개의 서비스가 상호작용하는 구조에서는 문제 발생 가능성도 자연스럽게 커진다.
- 언제나 일부 컴포넌트는 성능 저하 상태일 수 있다.
- 시스템은 점점 더 복잡하고, 예측 불가능해진다.
- 단순한 모니터링으로는 이상 징후를 찾기 어렵다.
- 시스템을 복원력 있게 설계해야 한다.
- 동시에 “지금 무슨 일이 벌어지고 있는지” 이해할 수 있는 도구가 필요하다.
- 메트릭, 로그, 트레이스를 통해 운영 중인 상태를 실시간 파악해야 한다.
- MTTR (Mean Time To Recovery) 는 장애 발생 후 복구까지 걸리는 평균 시간이다.
- MTTR을 줄이면 서비스의 신뢰도와 팀의 문제 대응력이 개선된다.
- 관찰 가능성은 MTTR 개선의 핵심 수단이다.
- Istio는 네트워크 트래픽을 프록시 레벨에서 모두 통제한다.
- 애플리케이션의 수정 없이도 메트릭, 로그, 트레이스 수집이 가능하다.
- 이로 인해 인프라 전반의 상태를 손쉽게 시각화하고 분석할 수 있다.
실습 구성 k8s v1.23.17 배포 ,istio v1.17.8 설치
- k8s 배포
kind create cluster --name myk8s --image kindest/node:v1.23.17 --config - <<EOF
kind: Cluster
apiVersion: kind.x-k8s.io/v1alpha4
nodes:
- role: control-plane
  extraPortMappings:
  - containerPort: 30000 # Sample Application (istio-ingrssgateway) HTTP
    hostPort: 30000
  - containerPort: 30001 # Prometheus
    hostPort: 30001
  - containerPort: 30002 # Grafana
    hostPort: 30002
  - containerPort: 30003 # Kiali
    hostPort: 30003
  - containerPort: 30004 # Tracing
    hostPort: 30004
  - containerPort: 30005 # Sample Application (istio-ingrssgateway) HTTPS
    hostPort: 30005
  - containerPort: 30006 # TCP Route
    hostPort: 30006
  - containerPort: 30007 # kube-ops-view
    hostPort: 30007
  kubeadmConfigPatches:
  - |
    kind: ClusterConfiguration
    controllerManager:
      extraArgs:
        bind-address: 0.0.0.0
  extraMounts: # 해당 부분 생략 가능
  - hostPath: /Users/les/workspace/istio-in-action/book-source-code-master # 각자 자신의 pwd 경로로 설정
    containerPath: /istiobook
networking:
  podSubnet: 10.10.0.0/16
  serviceSubnet: 10.200.1.0/24
EOF


# 노드에 기본 툴 설치
docker exec -it myk8s-control-plane sh -c 'apt update && apt install tree psmisc lsof wget bridge-utils net-tools dnsutils tcpdump ngrep iputils-ping git vim -y'

# kube-ops-view 설치
helm repo add geek-cookbook https://geek-cookbook.github.io/charts/
helm install kube-ops-view geek-cookbook/kube-ops-view --version 1.2.2 --set service.main.type=NodePort,service.main.ports.http.nodePort=30007 --set env.TZ="Asia/Seoul" --namespace kube-system
kubectl get deploy,pod,svc,ep -n kube-system -l app.kubernetes.io/instance=kube-ops-view


# metrics-server 설치
helm repo add metrics-server https://kubernetes-sigs.github.io/metrics-server/
helm install metrics-server metrics-server/metrics-server --set 'args[0]=--kubelet-insecure-tls' -n kube-system
kubectl get all -n kube-system -l app.kubernetes.io/instance=metrics-server
- istio 설치
# myk8s-control-plane 진입 후 설치 진행
docker exec -it myk8s-control-plane bash
-----------------------------------


# istioctl 설치
export ISTIOV=1.17.8
echo 'export ISTIOV=1.17.8' >> /root/.bashrc

curl -s -L https://istio.io/downloadIstio | ISTIO_VERSION=$ISTIOV sh -
cp istio-$ISTIOV/bin/istioctl /usr/local/bin/istioctl
istioctl version --remote=false

# default 프로파일 컨트롤 플레인 배포
istioctl install --set profile=default -y

# 빠져나오기
exit
-----------------------------------

# 설치 확인 : istiod, istio-ingressgateway, crd 등
kubectl get istiooperators -n istio-system -o yaml
kubectl get all,svc,ep,sa,cm,secret,pdb -n istio-system
kubectl get cm -n istio-system istio -o yaml
kubectl get crd | grep istio.io | sort

# 실습을 위한 네임스페이스 설정
kubectl create ns istioinaction
kubectl label namespace istioinaction istio-injection=enabled
kubectl get ns --show-labels

# istio-ingressgateway 서비스 : NodePort 변경 및 nodeport 지정 변경 , externalTrafficPolicy 설정 (ClientIP 수집)
kubectl patch svc -n istio-system istio-ingressgateway -p '{"spec": {"type": "NodePort", "ports": [{"port": 80, "targetPort": 8080, "nodePort": 30000}]}}'
kubectl patch svc -n istio-system istio-ingressgateway -p '{"spec": {"type": "NodePort", "ports": [{"port": 443, "targetPort": 8443, "nodePort": 30005}]}}'
kubectl patch svc -n istio-system istio-ingressgateway -p '{"spec":{"externalTrafficPolicy": "Local"}}'
kubectl describe svc -n istio-system istio-ingressgateway


# 내부 접속 테스트용 netshoot 파드 생성
cat <<EOF | kubectl apply -f -
apiVersion: v1
kind: Pod
metadata:
  name: netshoot
spec:
  containers:
  - name: netshoot
    image: nicolaka/netshoot
    command: ["tail"]
    args: ["-f", "/dev/null"]
  terminationGracePeriodSeconds: 0
EOF
1. 관찰 가능성이란 무엇인가
이스티오는 애플리케이션 수준 네트워크 계측을 보조
- 관찰 가능성(Observability)은 시스템의 특성이다.
- 외부에서 관찰되는 신호만으로도 내부 상태를 이해하고 추론할 수 있는 능력을 뜻한다.
- 시스템 내부를 보지 않고도 문제를 판단하고 원인을 찾아낼 수 있어야 한다.
- 이 개념은 루돌프 칼만이 1960년 논문에서 소개한 제어 이론에서 유래했다.
- 단순한 모니터링과는 다르며, 시스템을 제어하는 데 필요한 기초 정보 제공이 핵심이다.
- 시스템의 안정성 유지에는 관찰 가능성이 중요하다.
- 시스템이 언제 잘 동작하는지 알아야, 문제가 발생했을 때 문제인지 여부를 인식할 수 있다.
- 이를 바탕으로 자동 또는 수동 제어를 구성할 수 있다.
- Istio의 데이터 플레인은 요청 경로에 개입할 수 있는 위치에 존재한다.
- 트래픽 전환, 회복력 제어, 정책 강제 등을 이 위치에서 실행한다.
- 제어 로직이 흐르는 위치 = 관찰할 수 있는 위치이기도 하다.
- Istio는 네트워크 수준 메트릭을 수집한다.
- 이 메트릭은 애플리케이션 요청 단위의 정보를 기반으로 한다.
- 덕분에 런타임에서 무슨 일이 일어나는지 파악하는 데 유리하다.
- 하지만 관찰 가능성은 단순히 Istio 기능만으로 달성되는 것은 아니다.
- 이는 시스템 전체가 가져야 할 특성이다.
- 하나의 기능이 아닌 다층적 구성 요소와 계측 방법을 포함해야 한다.

- 관찰 가능성을 위한 요소
- 애플리케이션 계측 (예: 로그, 이벤트)
- 네트워크 계측 (예: Istio 메트릭, 트래픽 추적)
- 시그널 수집 인프라 (예: Prometheus, Grafana, Jaeger)
- 데이터베이스 및 백엔드 시스템의 상태 정보
- 정상 상태 + 이상 상태에 대한 풍부한 데이터가 전제되어야 한다.
- 데이터에서 전체 흐름을 조망할 수 있어야 진정한 관찰 가능성이 구현된다.
- Istio는 관찰 가능성을 지원하는 중요한 도구다.
- 특히 네트워크 경로에서 발생하는 데이터 계측을 통해 제어와 관찰을 동시에 가능하게 만든다.
정리
Istio는 네트워크 요청 경로에서 직접 제어와 관찰이 가능한 위치에 존재한다. 이 위치 덕분에 네트워크 메트릭 수집과 정책 적용이 동시에 가능하다.
1.1 Observability 관찰가능성 (휠씬 더 많은 데이터 수집) vs. monitoring 모니터링
- 모니터링
- 모니터링은 이미 오랫동안 사용된 익숙한 운영 관행이다.
- 시스템의 메트릭, 로그, 트레이스를 수집·집계하고, 미리 정의한 임계값과 비교하여 상태를 확인한다.
- 예를 들어, 디스크 사용량이 90%를 초과하면 경고를 발생시키고 조치를 취하는 방식이다.
- 모니터링의 목적은 이상 상태를 감지하고 알리는 것이다.
- 잘 알려진 실패 패턴에 대해서는 빠르게 대응할 수 있는 구조다.
- 하지만 예상치 못한 문제에 대해서는 무력할 수 있다
- 관찰가능성
- 관찰 가능성은 모니터링보다 훨씬 넓은 개념이다.
- 관찰 가능성은 알려지지 않은 문제까지 포함한다는 전제를 갖는다.
- 시스템이 예측하기 어려운 방식으로 실패할 수도 있음을 인정하고 설계하는 접근이다.
- 따라서, 단순한 메트릭을 넘어서 훨씬 더 많은 데이터를 수집해야 한다.
- 예: 사용자 ID, 요청 ID, 소스 IP 등 카디널리티가 높은 정보까지도 포함된다.
- 이렇게 수집된 데이터는 탐색과 쿼리를 통해 즉시 질문을 던질 수 있어야 한다.
- 관찰 가능성은 단순한 “알림 시스템”이 아니다.
- 예: 사용자 ID 400000021이 결제 중 10초 지연을 경험
- 디스크, CPU, 큐 등 기존 모니터링 지표는 정상일 수 있다.,하지만 사용자 경험은 분명히 이상하다.
- 관찰 가능성이 잘 구성된 시스템는
- 서비스 전체 경로를 따라간다.
- 요청이 어떤 레이어를 거쳤는지 확인할 수 있다.
- 각 단계에서 병목 또는 지연의 위치를 찾아낼 수 있다.
- 정리
- 모니터링은 정해진 경로에서 경고를 울리는 기능
- 관찰 가능성은 그 경로 바깥의, 문제까지 탐색할 수 있는 능력이다.
- 모니터링은 관찰 가능성의 부분 집합이다.
1.2 How Istio helps with observability 이스티오가 어떻게 관찰 가능성을 돕는가?
- Istio는 관찰 가능성을 보조하는 데 특화된 위치에 있다.
- Istio의 데이터 플레인 프록시인 Envoy는 모든 서비스 간 네트워크 요청 경로에 존재한다.
- 이 위치 덕분에 요청 흐름 전체를 관찰할 수 있다.
- Envoy는 다음과 같은 핵심 메트릭을 자동으로 수집한다.
- 초당 요청 수 (RPS)
- 요청 처리 시간 (백분위수 기준)
- 실패한 요청 수 등
- 메트릭은 특별한 코드 변경 없이 자동으로 포착된다.
- 동적으로 새로운 메트릭을 추가할 수 있다.
- 예상치 못한 상황에 대응할 수 있도록 계측 유연성도 갖췄다.
- 분산 시스템에서는 요청 흐름을 추적하는 것이 중요하다.
- 요청이 어떤 서비스, 어떤 구성 요소를 거쳤는지를 알아야 한다.
- 각 노드별 응답 시간, 서비스 호출 순서 등을 파악해야 한다
- Istio 시각화를 위한 도구
- Prometheus – 메트릭 수집
- Grafana – 대시보드 시각화
- Kiali – 서비스 메시 그래프 탐색
- 이들 도구는 Istio 설치 시 샘플 구성으로 포함될 수 있다.
2. Exploring Istio metrics 이스티오 메트릭 살펴보기 (실습)
2.1 Metrics in the data plane 데이터 플레인의 메트릭 - 엔보이 표준/상세 메트릭 설정 및 확인
- 실습 구성
- Envoy 프록시는 커넥션, 요청, 런타임 관련 다양한 메트릭을 기본 제공한다.
- 이 메트릭들을 활용하면 서비스의 네트워크 상태와 통신 상태를 효과적으로 파악할 수 있다.
- 실습에서는 예제 애플리케이션의 일부 구성 요소만 선택적으로 배포한다.
- 배포한 구성 요소를 통해 메트릭의 생성 위치, 수집 방식, 접근 경로를 직접 확인한다.
- Istio가 어떤 방식으로 관찰 가능성을 실현하는지 흐름을 따라가 본다.
- 최종적으로, 수집된 애플리케이션 네트워크 관련 메트릭을 탐색하고 시각화 가능한 영역으로 이동시킨다.
- 이 과정을 통해 관찰 가능한 시스템이 어떻게 구성되는지 Istio의 기능을 중심으로 확인하게 된다
- 실습 환경 구성
# catalog 앱 기동
kubectl apply -f services/catalog/kubernetes/catalog.yaml -n istioinaction

# webapp 앱 기동
kubectl apply -f services/webapp/kubernetes/webapp.yaml -n istioinaction

# gateway, virtualservice 설정
kubectl apply -f services/webapp/istio/webapp-catalog-gw-vs.yaml -n istioinaction

# 확인
kubectl get deploy,pod,svc,ep,gw,vs -n istioinaction
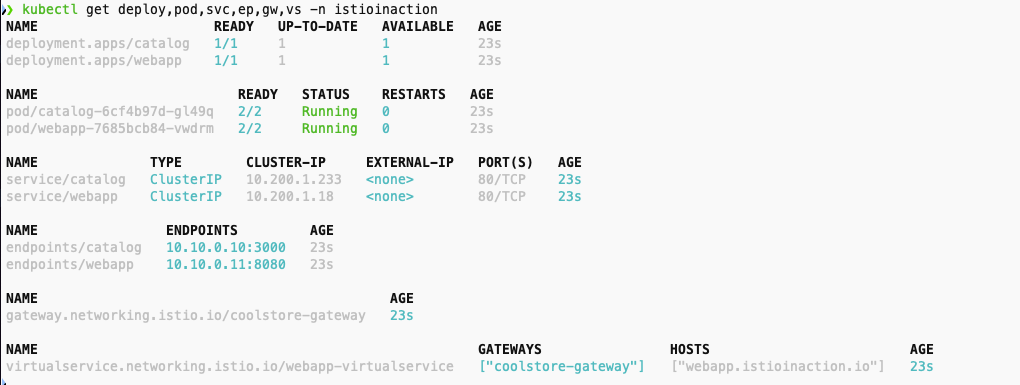
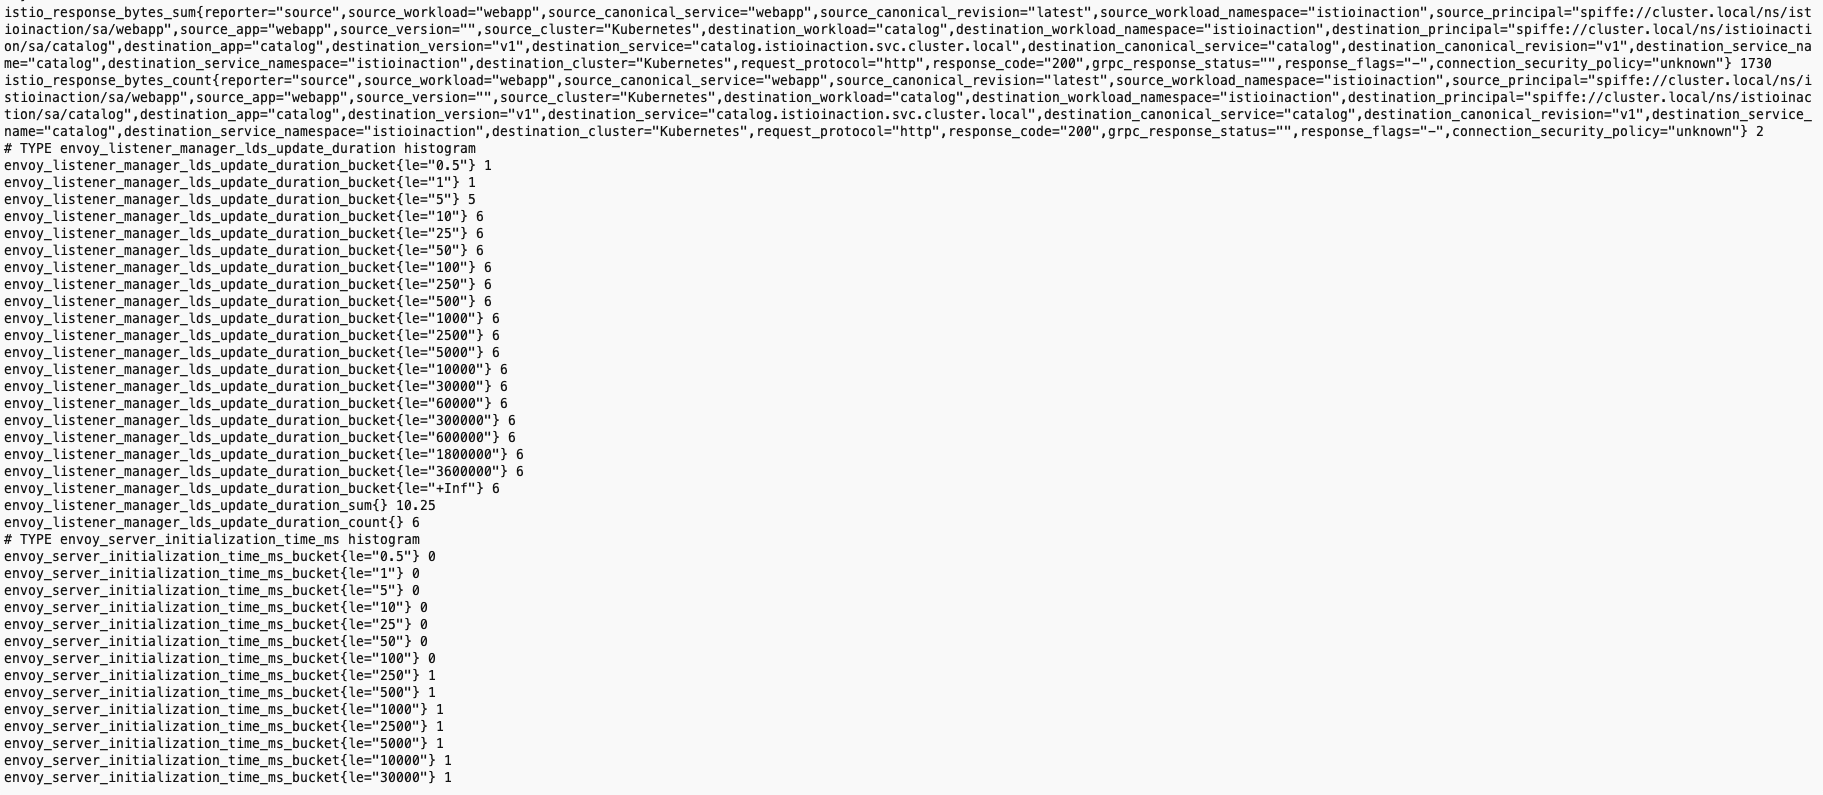
- 서비스 사이드카 프로시가 유지하는 메트릭 확인
- 가장 중요한 부분은 마지막 istio_request_total 이다.
- 인그레스 게이트웨이에서 webapp 서비스로 들어오는 요청에 대한 메트릭이며 그 요청이 총 2개
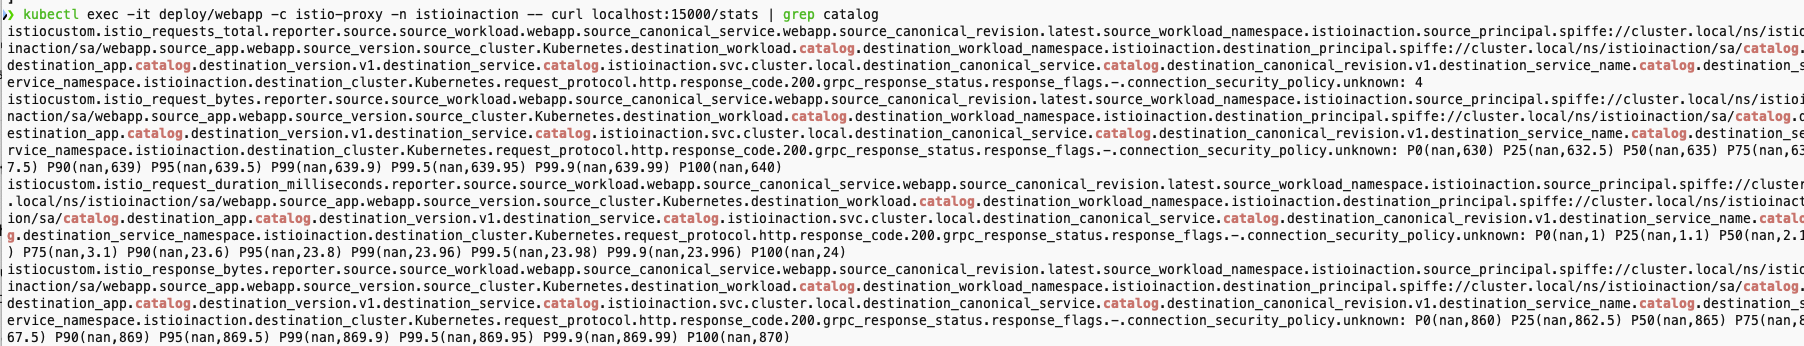
- 표준 이스티오 메트릭
- istio_requests_total: istio 프록시가 처리한 모든 요청에 대해 증가하는 카운터(COUNTER)
- istio_request_bytes : HTTP 요청 바디 크기를 측정하는 분포(DISTRIBUTION) 타입 메트릭
- istio_response_bytes: HTTP 응답 바디 크기를 측정하는 분포(DISTRIBUTION) 메트릭
- istio_request_duration_milliseconds: 각 요청이 처리되는 데 걸린 시간(밀리초 단위) 를 측정하는 분포 메트릭
- catlog 메트릭
# catalog
kubectl exec -it deploy/catalog -c istio-proxy -n istioinaction -- curl localhost:15000/stats | grep istio_

- webapp 메트릭
kubectl exec -it deploy/webapp -c istio-proxy -n istioinaction -- curl localhost:15000/stats | grep istio_

프록시가 엔보이 통계를 더 많이 보고하도록 설정하기
- 가끔 네트워크 동작을 트러블슈팅하려면 표준 이스티오 메트릭보다 더 많은 정보를 확인해야 할 때가 있다.
- 애플리케이션 호출이 자신의 클라이언트 측 프록시를 거쳐갈 때, 프록시는 라우팅 결정을 내리고 업스트릠 클러스터로 라우팅한다.
- 업스트림 클러스터란 관련 설정(로드 밸런싱, 보안, 서킷 브레이커 설정 등)을 적용해 실제 호출되는 서비스를 말한다.
- 이 예제에서는 webapp 서비스가 catalog 서비스로 라우팅된다.
- 업스트림 catalog 서비스 호출에 추가 정보를 활성해화보자.
- 방법 1 (IstioOperator 명세) : 메시 전체에 적용-Docs
- 메시 전체에 수집하는 메트릭을 늘리면 시스템을 과부하 상태가 될수 있다.
apiVersion: install.istio.io/v1alpha1
kind: IstioOperator
metadata:
  name: control-plane
spec:
  profile: demo
  meshConfig:
    defaultConfig: # Defines the default proxy configuration for all services
      proxyStatsMatcher: # Customizes the reported metrics
        inclusionPrefixes: # Metrics matching the prefix will be reported alongside the default ones.
        - "cluster.outbound|80||catalog.istioinaction"
- 방법 2 (해당 워크로드 별 명세) : 워크로드 단위로 설정(애노테이션으로 포함할 메트릭 지정) ← 권장 방법
- 적용 전 확인
# 호출테스트
curl -s http://webapp.istioinaction.io:30000/api/catalog | jq

# 적용 전 확인
kubectl exec -it deploy/webapp -c istio-proxy -n istioinaction -- curl localhost:15000/stats | grep catalog
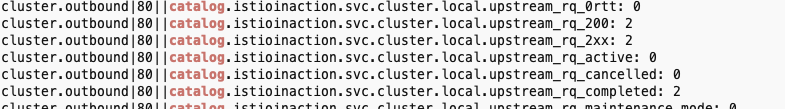
- 적용 후 확인
- catalog.istioinaction 에 대한 metrics 추가
- upstream 클러스터로 향햐는 커넥션 혹은 요청 시 circuit breaking 작동 확인
# webapp-deployment-stats-inclusion.yaml
---
apiVersion: apps/v1
kind: Deployment
metadata:
  labels:
    app: webapp
  name: webapp
spec:
  replicas: 1
  selector:
    matchLabels:
      app: webapp
  template:
    metadata:
      annotations:
        proxy.istio.io/config: |-
          proxyStatsMatcher:
            inclusionPrefixes:
            - "cluster.outbound|80||catalog.istioinaction" # catalog.istioinaction 에 대한 metrics 추가
      labels:
        app: webapp
    spec:
      containers:
      - env:
        - name: KUBERNETES_NAMESPACE
          valueFrom:
            fieldRef:
              fieldPath: metadata.namespace
        - name: CATALOG_SERVICE_HOST
          value: catalog.istioinaction
        - name: CATALOG_SERVICE_PORT
          value: "80"
        - name: FORUM_SERVICE_HOST
          value: forum.istioinaction
        - name: FORUM_SERVICE_PORT
          value: "80"
        image: istioinaction/webapp:latest
        imagePullPolicy: IfNotPresent
        name: webapp
        ports:
        - containerPort: 8080
          name: http
          protocol: TCP
        securityContext:
          privileged: false

# 적용
kubectl apply -n istioinaction -f ch7/webapp-deployment-stats-inclusion.yaml

# 호출 테스트
curl -s http://webapp.istioinaction.io:30000/api/catalog | jq
curl -s http://webapp.istioinaction.io:30000/api/catalog | jq


# 메트릭 확인
kubectl exec -it deploy/webapp -c istio-proxy -n istioinaction -- curl localhost:15000/stats | grep catalog

- cluster_name.internal.* 메트릭 확인
- 엔보이는 트래픽을 식별 할 때 출처가 내부인지 외부인지를 구분한다.
- 내부는 보통 메시 내부 트래픽이라 인식하는 것을 말하고, 외부는 메시 외부에서 시작한 트래픽(인그레스 게이트웨이로 들어온 트래픽)을 말한다
# cluster_name.internal.*. 메트릭을 보면 메시 내부에서 시작해 성공한 요청 개수를 확인 할 수 있다.
kubectl exec -it deploy/webapp -c istio-proxy -n istioinaction -- curl localhost:15000/stats | grep catalog | grep internal

- cluster_name.ssl.* 메트릭 확인
- 트래픽이 TLS로 업스트림 클러스터로 이동하는지 여부와 커넥션과 관련된 기타 세부 정보(cipher, curve 등)을 알아내는 데 매우 유용하다.
# cluster_name.internal.*. 메트릭을 보면 메시 내부에서 시작해 성공한 요청 개수를 확인 할 수 있다.
kubectl exec -it deploy/webapp -c istio-proxy -n istioinaction -- curl localhost:15000/stats | grep catalog | grep ssl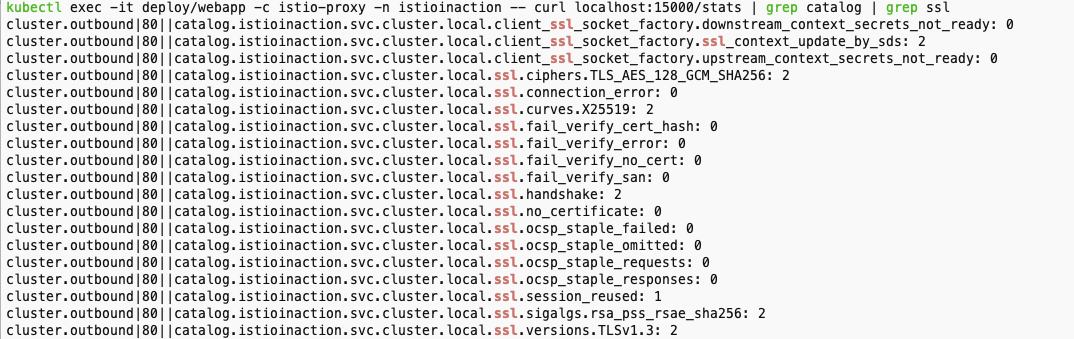
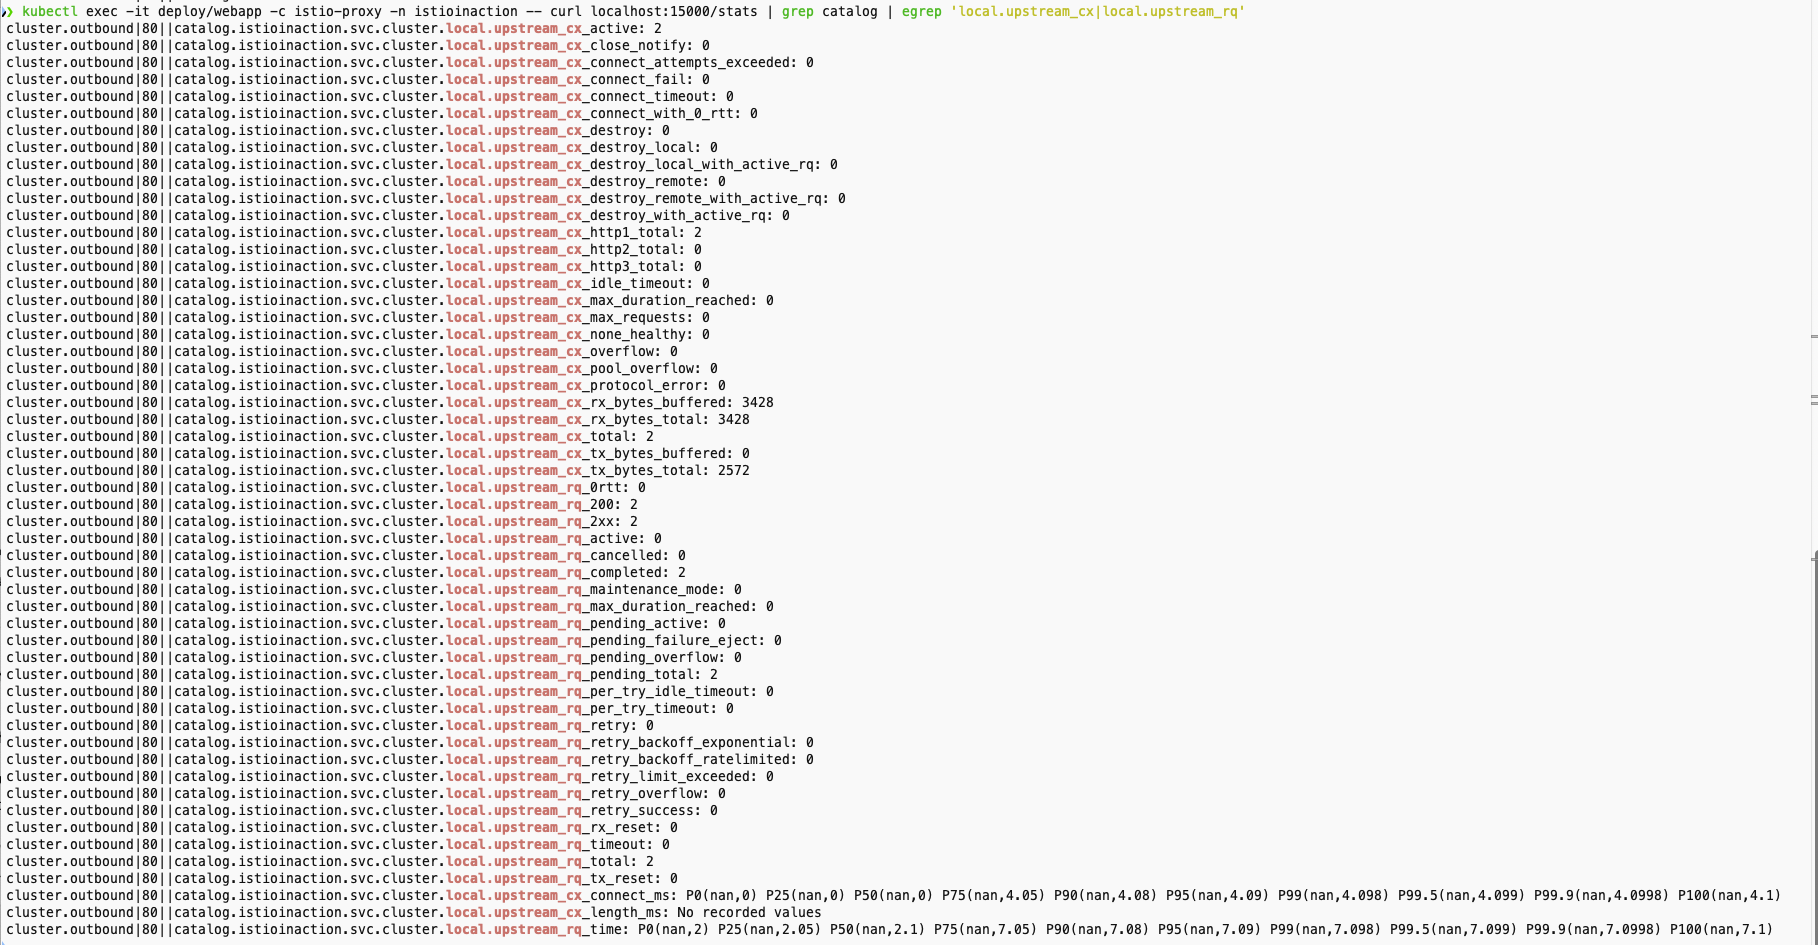
- upstream_cx 와 upstream_rq 메트릭 확인
# 업스트림 커넥션 및 요청에 대한 메트릭
kubectl exec -it deploy/webapp -c istio-proxy -n istioinaction -- curl localhost:15000/stats | grep catalog | egrep 'local.upstream_cx|local.upstream_rq'
- LB 메트릭 확인
kubectl exec -it deploy/webapp -c istio-proxy -n istioinaction -- curl localhost:15000/stats | grep catalog | grep lb

- 기타 업스트림 클러스터용 메트릭은 엔보이 문서를 참고 - Docs
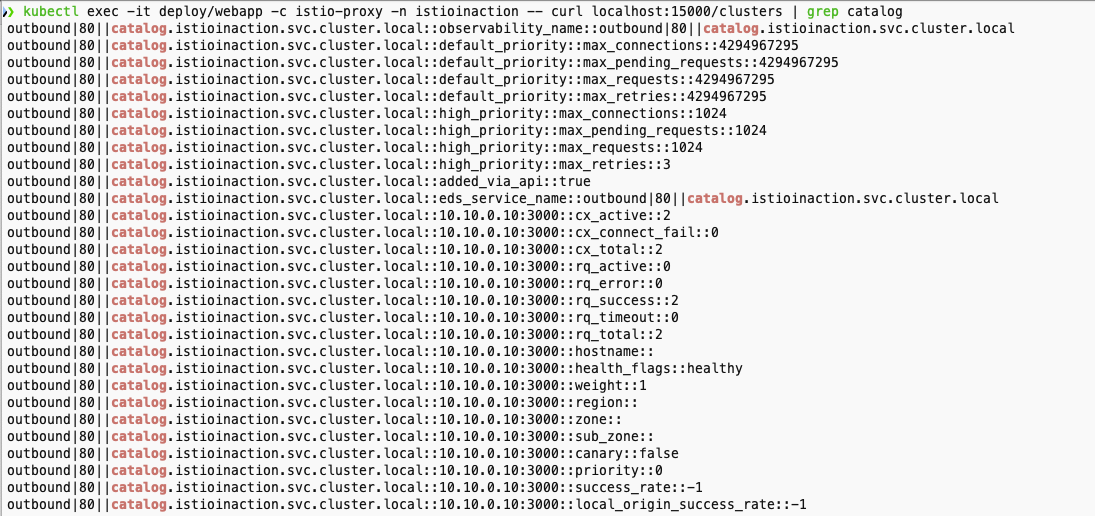
- 프록시가 알고 있는 모든 백엔드 클러스터에 대한 정보와 그들의 엔드포인트 확인
- 특정 업스트림 클러스터에 대한 자세한 정보를 볼 수 있다.
- 클러스터에는 어떤 엔드포인트(이 경우 10.10.0.10)가 있는지, 해당 엔드포인트가 속한 리전, 영역, 하위 영역은 어디인지, 해당 엔드포인트에 활성 요청 또는 오류가 있는지 등의 정보가 포함된다.
- 앞 선 통계 집합은 클러스터 전체 정보였는데, 이 통계 집합에서는 엔드포인트별로 자세한 정보를 볼 수 있다.
kubectl exec -it deploy/webapp -c istio-proxy -n istioinaction -- curl localhost:15000/clusters | grep catalog
- 프록시는 메트릭을 잘 수집하고 있지만 이스티오 프록시는 프로메테우스나 데이터독 같은 메트릭 수집 시스템으로 긇어 갈 수 있다.
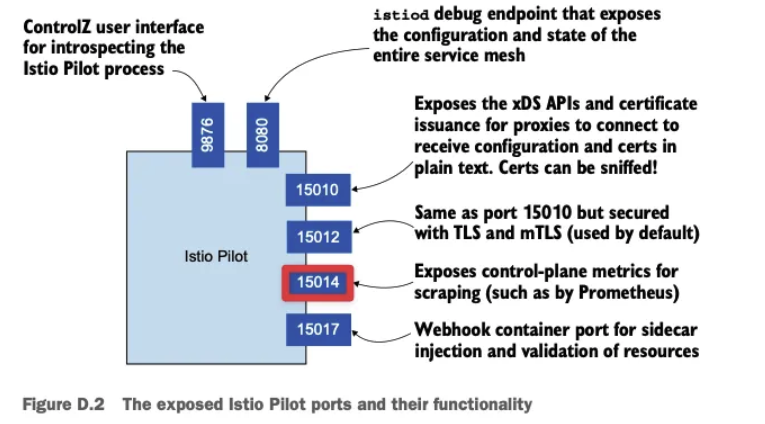
2.2 Metrics in the control plane 컨트롤 플레인의 메트릭 - citadel, pilot, xds 메트릭 확인

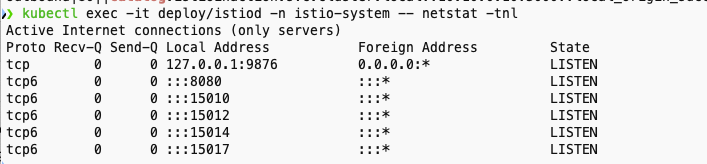
- 위 그림의 구성을 터미널 명령어로 확인 해보자
- istiod 파드에 tcp LISTEN port 정보 확인
kubectl exec -it deploy/istiod -n istio-system -- netstat -tnl
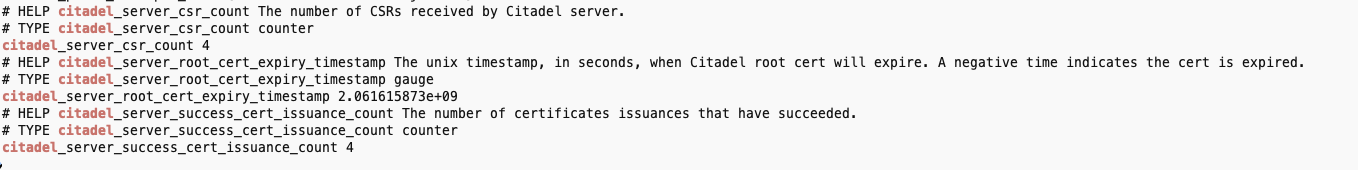
- 컨트롤 플레인 메트릭 확인
- CSR : Certificate Signing Request 인증서 발급 요청
- Citadel : Istio 보안 컴포넌트
kubectl exec -it -n istio-system deploy/istiod -n istio-system -- curl localhost:15014/metrics | grep citadel
- 컨트롤 플레인 버전에 대한 런타임 정보 확인
kubectl exec -it -n istio-system deploy/istiod -n istio-system -- curl localhost:15014/metrics | grep istio_build

- proxy_convergence 메트릭 확인
- 설정을 데이터 플레인 프록시에 밀어넣고 동기화하는 데 소용되는 시간의 분포
- 설정 수렴 이벤트 25개 중 25개가 0.1초 이하의 시간이 걸렸다(le=’0.1’ 로 표시), le는 ‘이하’를 의미 한다.
kubectl exec -it -n istio-system deploy/istiod -n istio-system -- curl localhost:15014/metrics | grep convergence
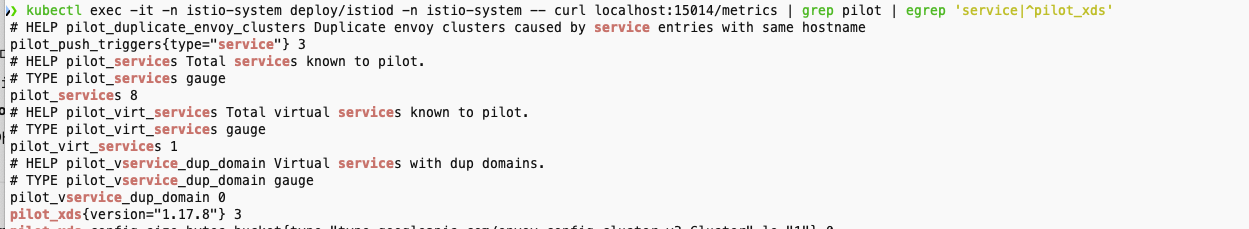
- 컨트롤 플레인에 알려진 서비스 개수, 사용자가 설정한 VirtualService 리소스 개수, 연결된 프록시 개수 확인
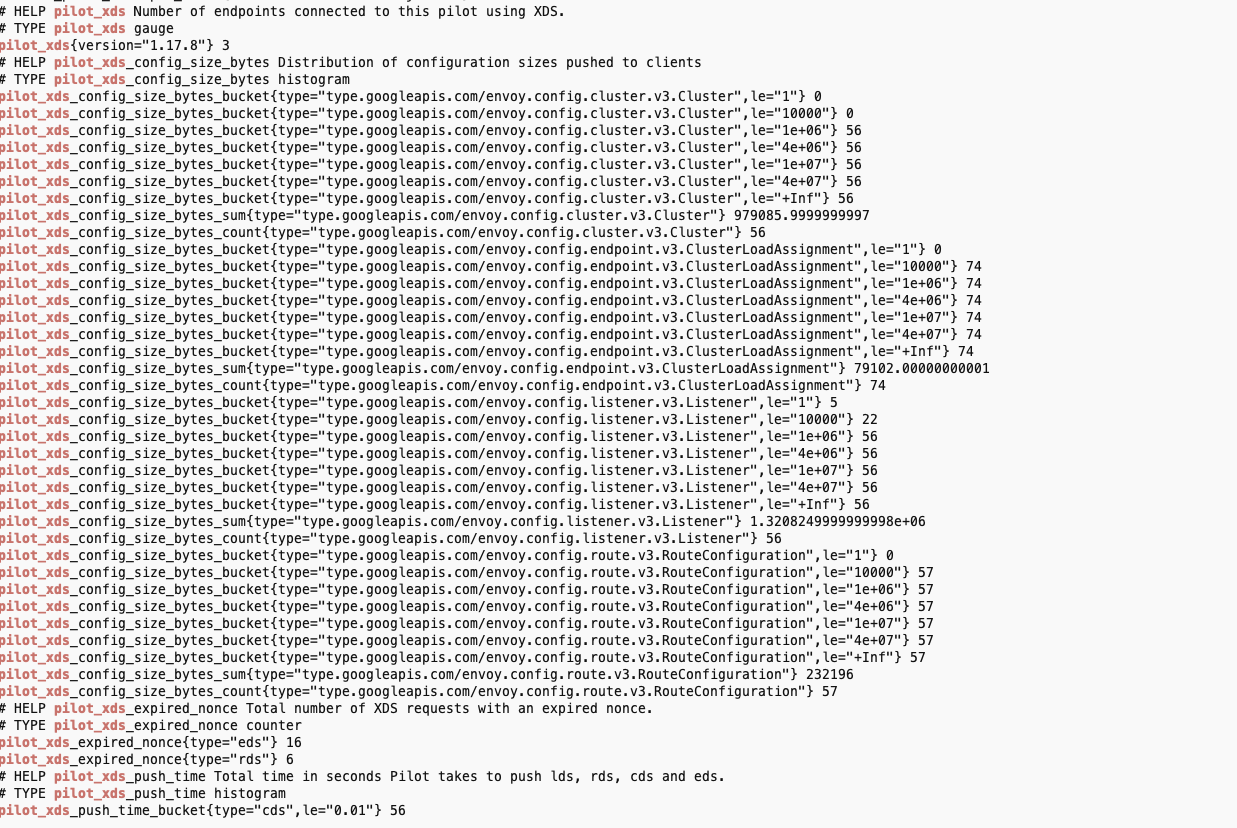
kubectl exec -it -n istio-system deploy/istiod -n istio-system -- curl localhost:15014/metrics | grep pilot | egrep 'service|^pilot_xds'
- 특정 xDS API의 업데이트 횟수
- CDS,EDS,LDS/RDS,SDS 등 업데이트 횟수
# xDS별 업데이트 횟수 (counter)
kubectl exec -it -n istio-system deploy/istiod -n istio-system -- curl localhost:15014/metrics | grep pilot_xds_pushes

- 이런 세부 사항을 노출하는 것은 관찰 가능한 시스템을 구축하는 데 중요하다.
- 메트릭들을 얻자고 데이터 플레인이나 컨트롤 플레인의 각 구성 요소에 일일이 접근하는 것은 비현실적이다.
- 메트릭 수집과 시계열 데이터베이스 시스템을 어떻게 사용하면 이 과정을 자동화하고 데이터를 쓸 만한 방식으로 표시할 수 있다. -> 프로메테우스
3. 이스티오 메트릭 수집 with 프로메테우스
프로메테우스, 메트릭 엔드포인트
- 프로메테우스란?
- 프로메테우스는 사운드크라우드에서 시작된 메트릭 수집엔진이자, 관련된 모니터링 및 알림 도구 모음
- 내부 구조는 Google의 Borgmon 시스템에 영향을 받았으며, Kubernetes가 Borg에서 유래된 것처럼 유사한 기원을 공유
- 다른 메트릭 수집 시스템과 달리 push 방식이 아닌 pull 방식을 사용합니다.
- 애플리케이션이나 프록시가 메트릭을 제공하는 엔드포인트를 노출하면, Prometheus가 직접 그 정보를 주기적으로 긁어옵니다.
- 이 방식은 에이전트가 메트릭을 중앙 서버에 “밀어넣는” 방식보다 구성과 확장성 면에서 유리할 수 있습니다.
- 하나의 대상을 여러 Prometheus 서버가 동시에 긁어갈 수 있어, 고가용성 구성이 쉽습니다.
- 예를 들어, 동일한 webapp 파드의 /metrics 엔드포인트를 여러 Prometheus 인스턴스가 공유할 수 있습니다.
- Istio 환경에서는 모든 사이드카 프록시(Envoy)가 자체적으로 메트릭을 노출하며, Prometheus는 이를 수집할 수 있습니다.

- 이스티오 서비스 프록시 메트릭을 프로메테우스 형식으로 노출하는 HTTP 엔드포인트를 curl 명령어 호출
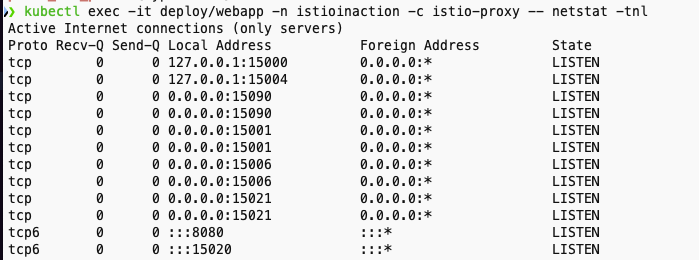
# istiod 파드에 tcp LISTEN port 정보 확인
kubectl exec -it deploy/webapp -n istioinaction -c istio-proxy -- netstat -tnl

# 앞서 살펴본 /stats 을 프로메테우스 형식으로 출력 : 서비스 프록시가 프로메테우스 메트릭을 노출하는 15090 포트로 curl 실행 확인
## /stats 는 istio-proxy 가 수집한 통계정보 출력. 디버깅/모니터링 용도. /reset_counters 로 초기화
## /stats/prometheus 는 istio-proxy 가 수집한 통계정보를 prometheus에 제공하기 위한 exporter endpoint. /reset_counters 로 초기화 할 수 없음
kubectl exec -it deploy/webapp -c istio-proxy -n istioinaction -- curl localhost:15090/stats
kubectl exec -it deploy/webapp -c istio-proxy -n istioinaction -- curl localhost:15090/stats/prometheus

kubectl exec -it deploy/webapp -c istio-proxy -n istioinaction -- curl localhost:15020/metrics
- 프로메테우스가 예상하는 형식으로 된 메트릭 목록이 보인다.
- 이스티오 프록시가 주입된 모든 애플리케이션은 자동으로 이런 프로메테우스 메트릭을 노출한다.
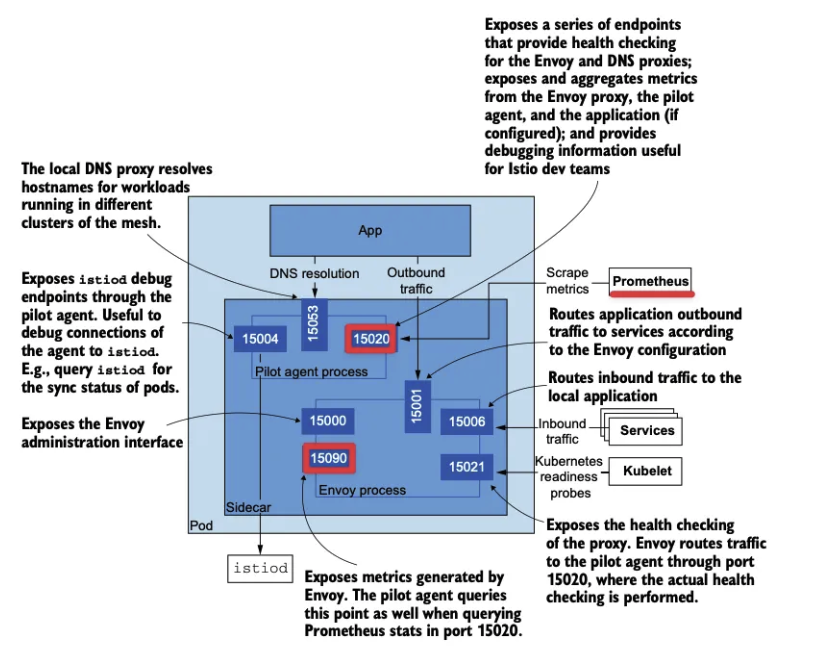
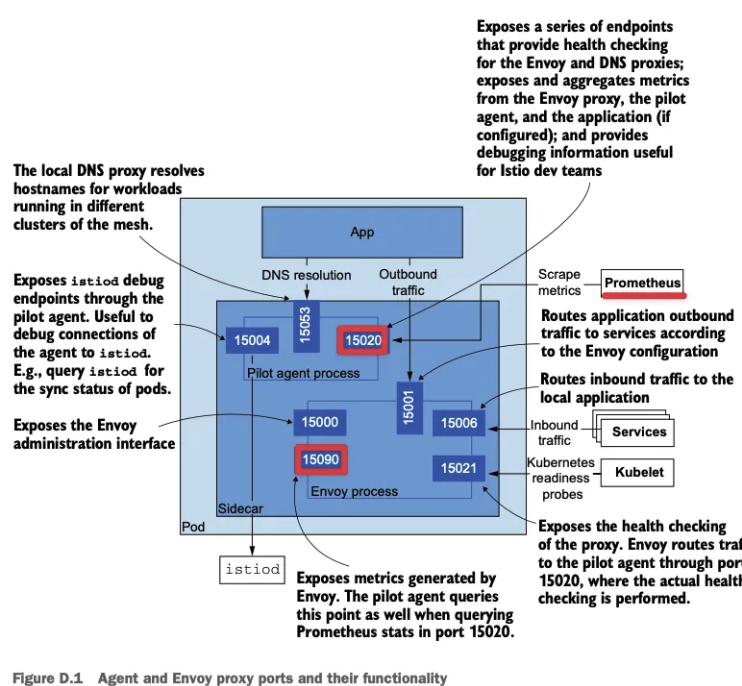
- 15090 포트 : 엔보이 프록시의 다음과 같은 메트릭 노출
- xDS 통계
- 연결 상태 통계
- HTTP 요청 처리 통계
- 아웃라이어 감지 통계
- 헬스 체크, 회로 차단기 상태 등
- 15020 포트 : 다음 메트릭을 노출
- Envoy 프록시로부터 15090 포트를 통해 메트릭을 집계하고 재노출
- 애플리케이션 자체 메트릭 (만약 설정된 경우)
- 프록시의 헬스 체크 및 DNS 상태 정보
- Pilot Agent의 디버깅 용도로 CPU, 메모리 상태, 프로파일링 정보 등을 제공 (주로 VM 환경에서 유용)
Push vs Pull 메트릭 수집 방식 비교
- Push 방식
- 각 애플리케이션이 중앙 수집 서버로 메트릭을 전송
- 예: StatsD, Graphite, Telegraf, Fluentd
- Pull 방식
- 수집 서버가 주기적으로 애플리케이션에 접속해 메트릭을 요청
- 예: Prometheus
- 장단점 비교
| 항목 | Push 방식 | Pull 방식 |
| 구성 유연성 | 서버 구성은 단순, 클라이언트에 로직 필요 | 수집 서버에서 제어 가능, 클라이언트는 단순 |
| 스케일링 | 대규모 시스템에서 트래픽 집중 위험 (특히 Push 타이밍이 겹칠 경우) | 서버가 Pull 주기를 조절 가능하여 트래픽 분산 용이 |
| 신뢰성 | 네트워크 중단 시 데이터 손실 위험 높음 (클라이언트에 버퍼 없으면) | 서버가 재시도하거나 지연 시도 가능하여 안정적 |
| 보안/제어 | 서버가 외부 노출되지 않아 수신 전용으로 보안에 유리 | 서버가 직접 접속해야 하므로 방화벽 설정, ACL 등 추가 필요 |
| 유실 복구 | Push 실패 시 보통 유실됨 (로컬 큐 없으면) | Pull 실패 시 재시도 가능 |
| 고가용성 구성 | Push 대상 중복 수신은 복잡함 | Pull 대상 중복 수집이 쉬움 |
| 메트릭 도달 시간 | Push 즉시 도달 | Pull 간격 조절로 컨트롤 가능 ( 실시간성 떨어짐) |
- 정리
- Push는 간단하고 빠르지만 유실 위험이 있다.
- Pull은 중앙 제어에 강하지만 구성 복잡성과 실시간성 한계가 있습니다.
3.1 프로메테우스와 그라파나 설정 : kube prometheus stack 설치
- kube-prometheus-stack 프로젝트의 목적은 ‘프로메테우스 오퍼레이터나 그라파나, Alertmanager, Node exporter, Kube API용 어댑터 등’ 부수적인 부분들을 포함해 프로메테우스의 현실적이고 고가용성인 배포 형상을 사전에 선별하고 통합하는 것이다.
- kube-prometheus-stack 설치 - Helm_13.13.1
# 레파지토리 등록
helm repo add prometheus-community https://prometheus-community.github.io/helm-charts
helm repo update
#
cat ch7/prom-values.yaml
open ch7/prom-values.yaml
cat << EOF > prom-values-2.yaml
prometheusOperator:
tls:
enabled: false
admissionWebhooks:
patch:
enabled: false
prometheus:
service:
type: NodePort
nodePort: 30001
grafana:
service:
type: NodePort
nodePort: 30002
EOF
# helm 설치
kubectl create ns prometheus
helm install prom prometheus-community/kube-prometheus-stack --version 13.13.1 \
-n prometheus -f ch7/prom-values.yaml -f prom-values-2.yaml
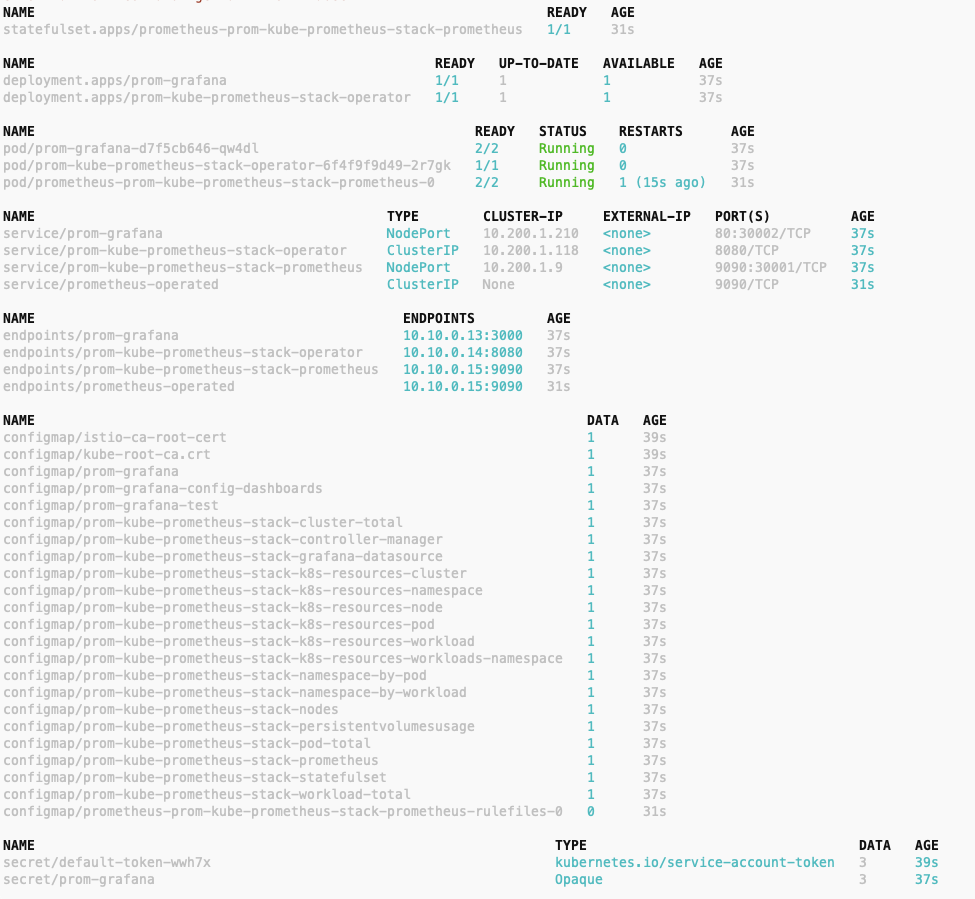
# 확인
helm list -n prometheus
kubectl get-all -n prometheus # krew plugin
kubectl get sts,deploy,pod,svc,ep,cm,secret -n prometheus
kubectl get crd | grep monitoring
kubectl get prometheus,servicemonitors -n prometheus
# 프로메테우스 버전 확인
kubectl exec -it sts/prometheus-prom-kube-prometheus-stack-prometheus -n prometheus -c prometheus -- prometheus --version

3.2 이스티오 컨트롤 플레인과 워크로드를 긁어가도록 프로메테우스 오퍼레이터 설정하기
- 이스티오에서 메트릭을 수집 설정 하기 위해서는 프로메테우스 오퍼레이터의 커스텀 리소스 ServiceMonitor 와 PodMonitor를 사용한다.
- 프로메테우스 오퍼레이터 리포지터리의 설계 문서
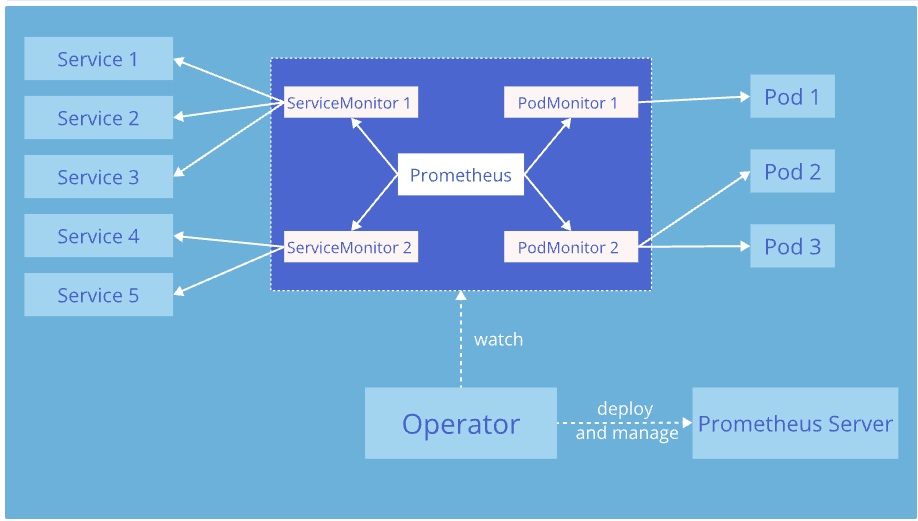


- ServiceMonitor 리소스를 설정
ServiceMonitor 리소스 코드
# service-monitor-cp.yaml
apiVersion: monitoring.coreos.com/v1
kind: ServiceMonitor
metadata:
  name: istio-component-monitor
  namespace: prometheus
  labels:
    monitoring: istio-components
    release: prom
spec:
  jobLabel: istio
  targetLabels: [app]
  selector:
    matchExpressions:
    - {key: istio, operator: In, values: [pilot]}
  namespaceSelector:
    any: true
  endpoints:
  - port: http-monitoring # 15014
    interval: 15s
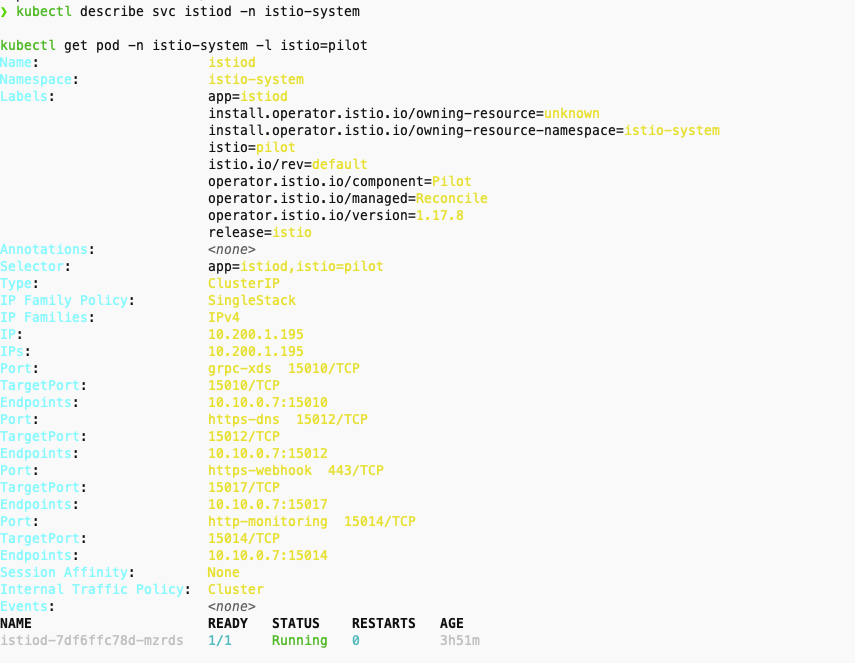
- istiod의 Service Spec ServiceMonitor 에서 selector 에 istio=pilot 매칭 확인
kubectl describe svc istiod -n istio-system

kubectl get pod -n istio-system -l istio=pilot
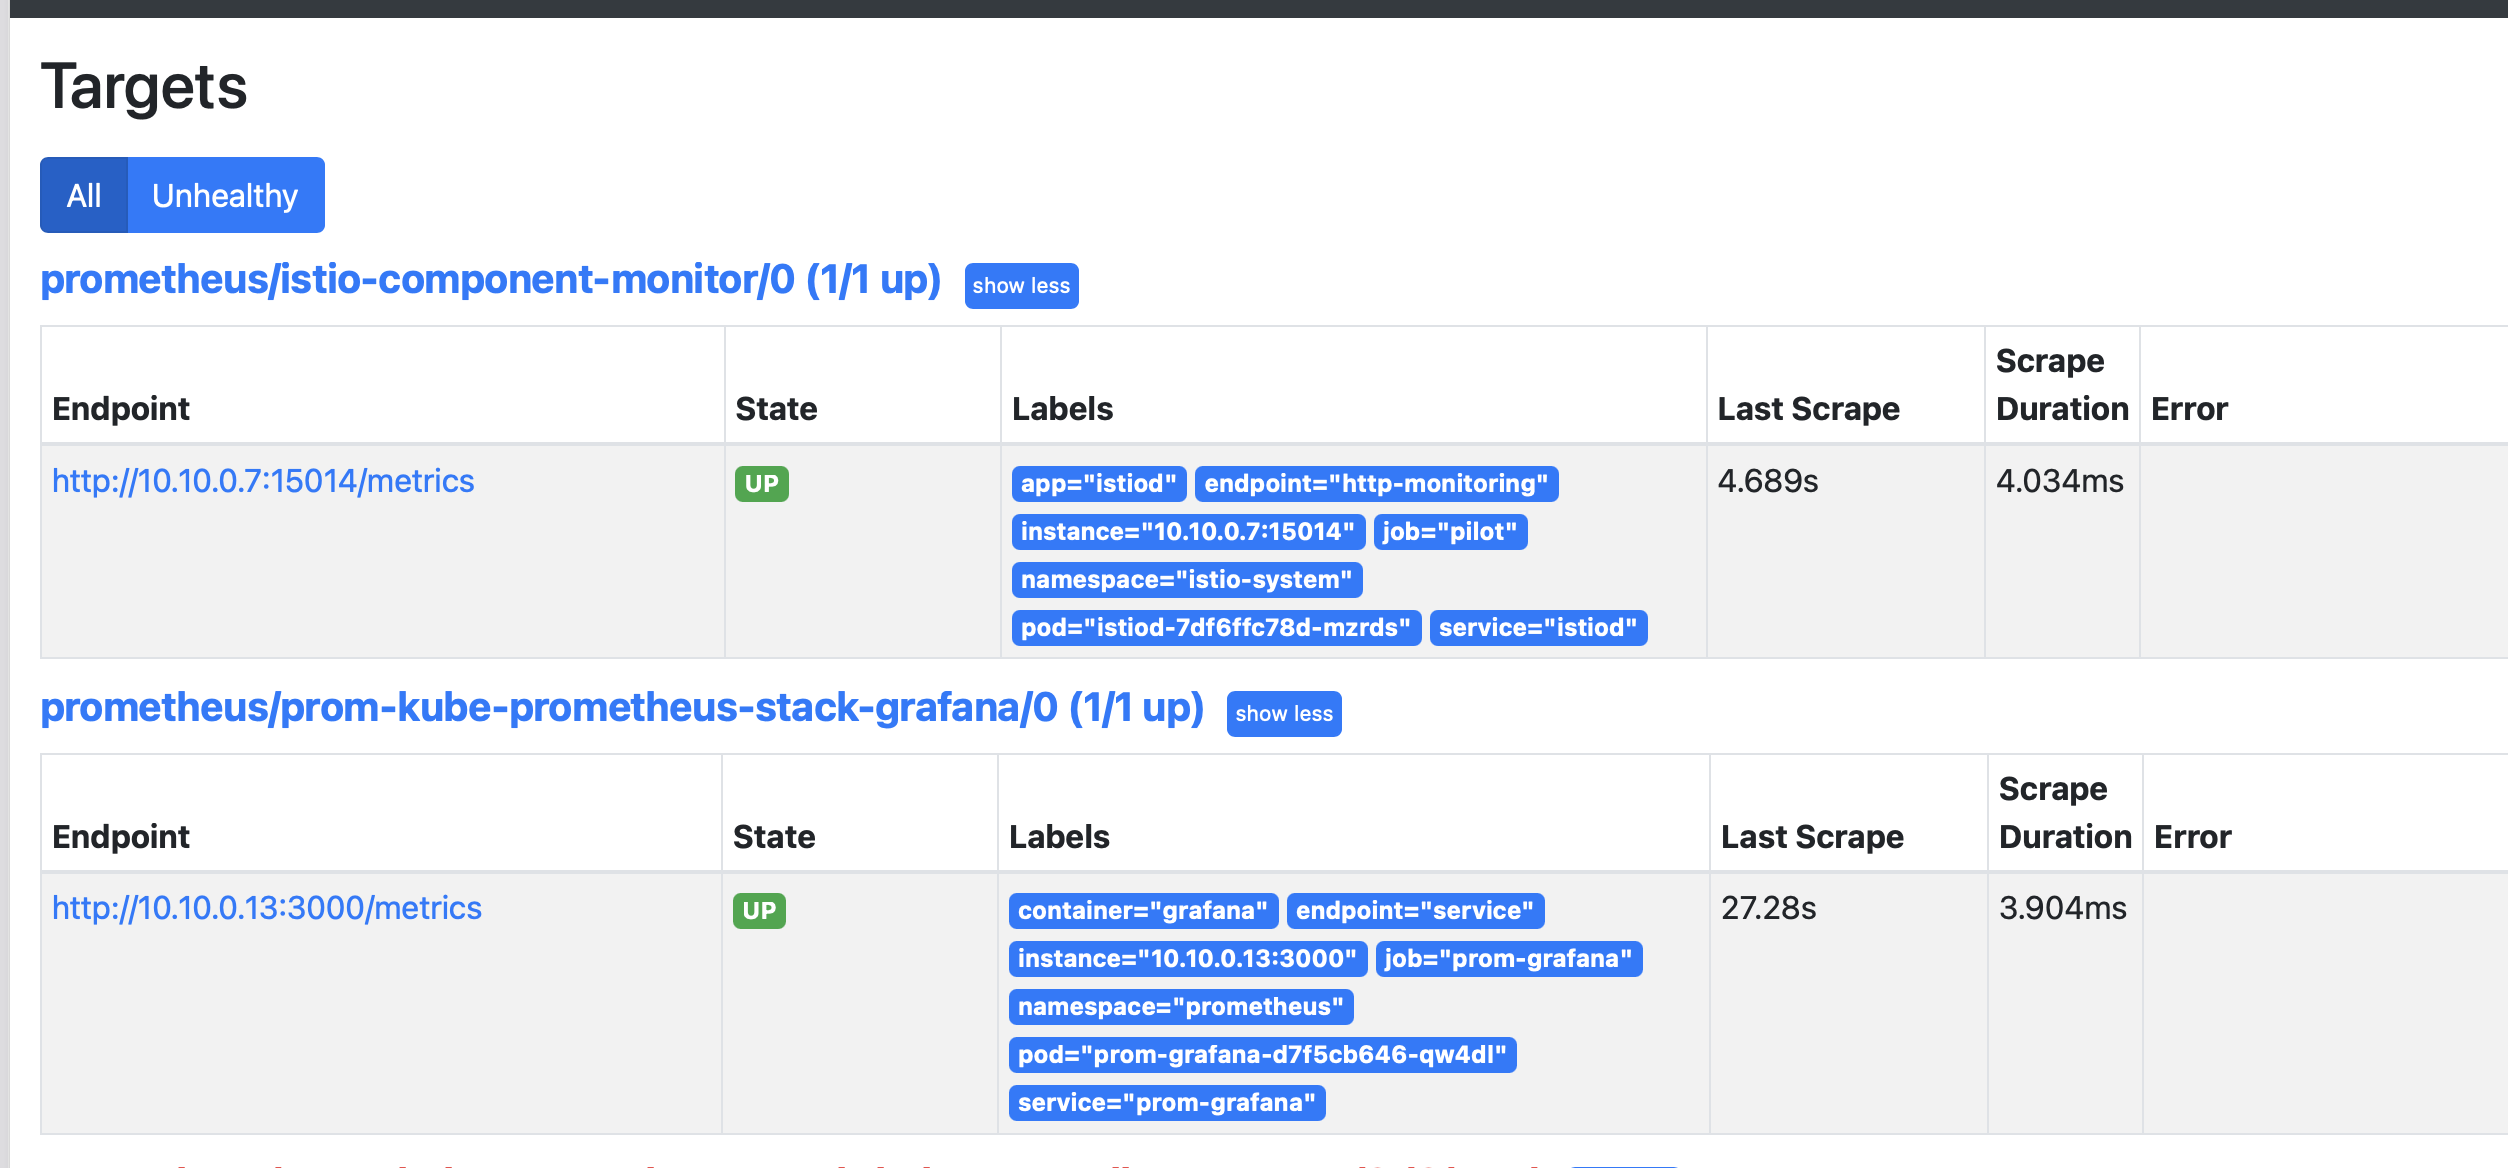
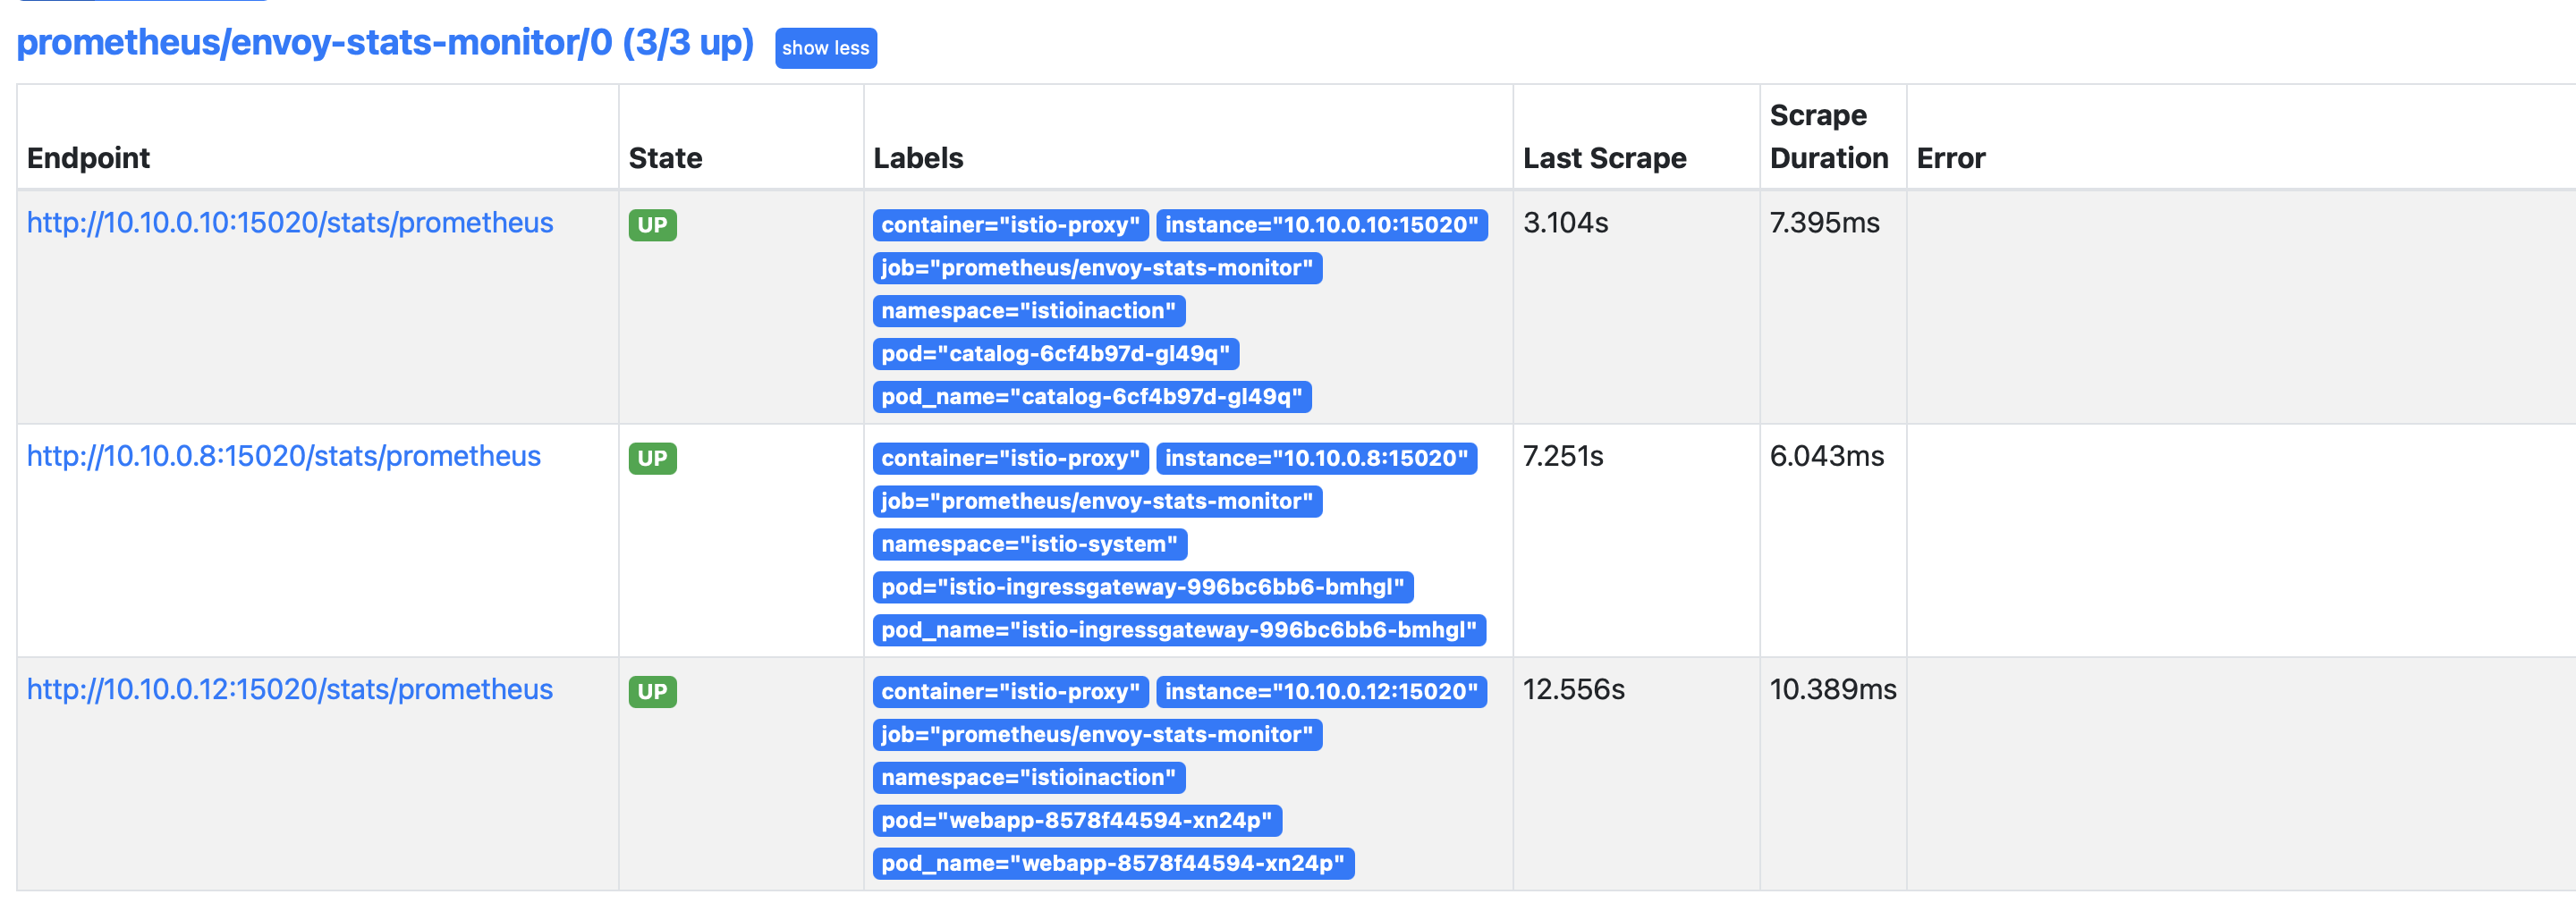
- ServiceMonitor 적용, 프로메테우스 웹 확인 (Service Discovery, Targets)
kubectl apply -f ch7/service-monitor-cp.yaml -n prometheus

# 확인
kubectl get servicemonitor -n prometheus
kubectl exec -it netshoot -- curl -s istiod.istio-system:15014/metrics
kubectl exec -it netshoot -- curl -s istiod.istio-system:15014/metrics | grep pilot_xds
kubectl exec -it netshoot -- curl -s istiod.istio-system:15014/metrics | grep citadel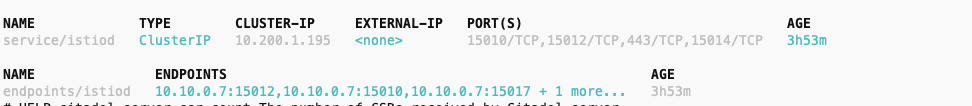

- 데이터 플레인 수집 활성화
- PodMonitor 리소스를 사용해 istio-proxy 컨테이너를 포함하는 모든 파드에서 메트릭을 수집
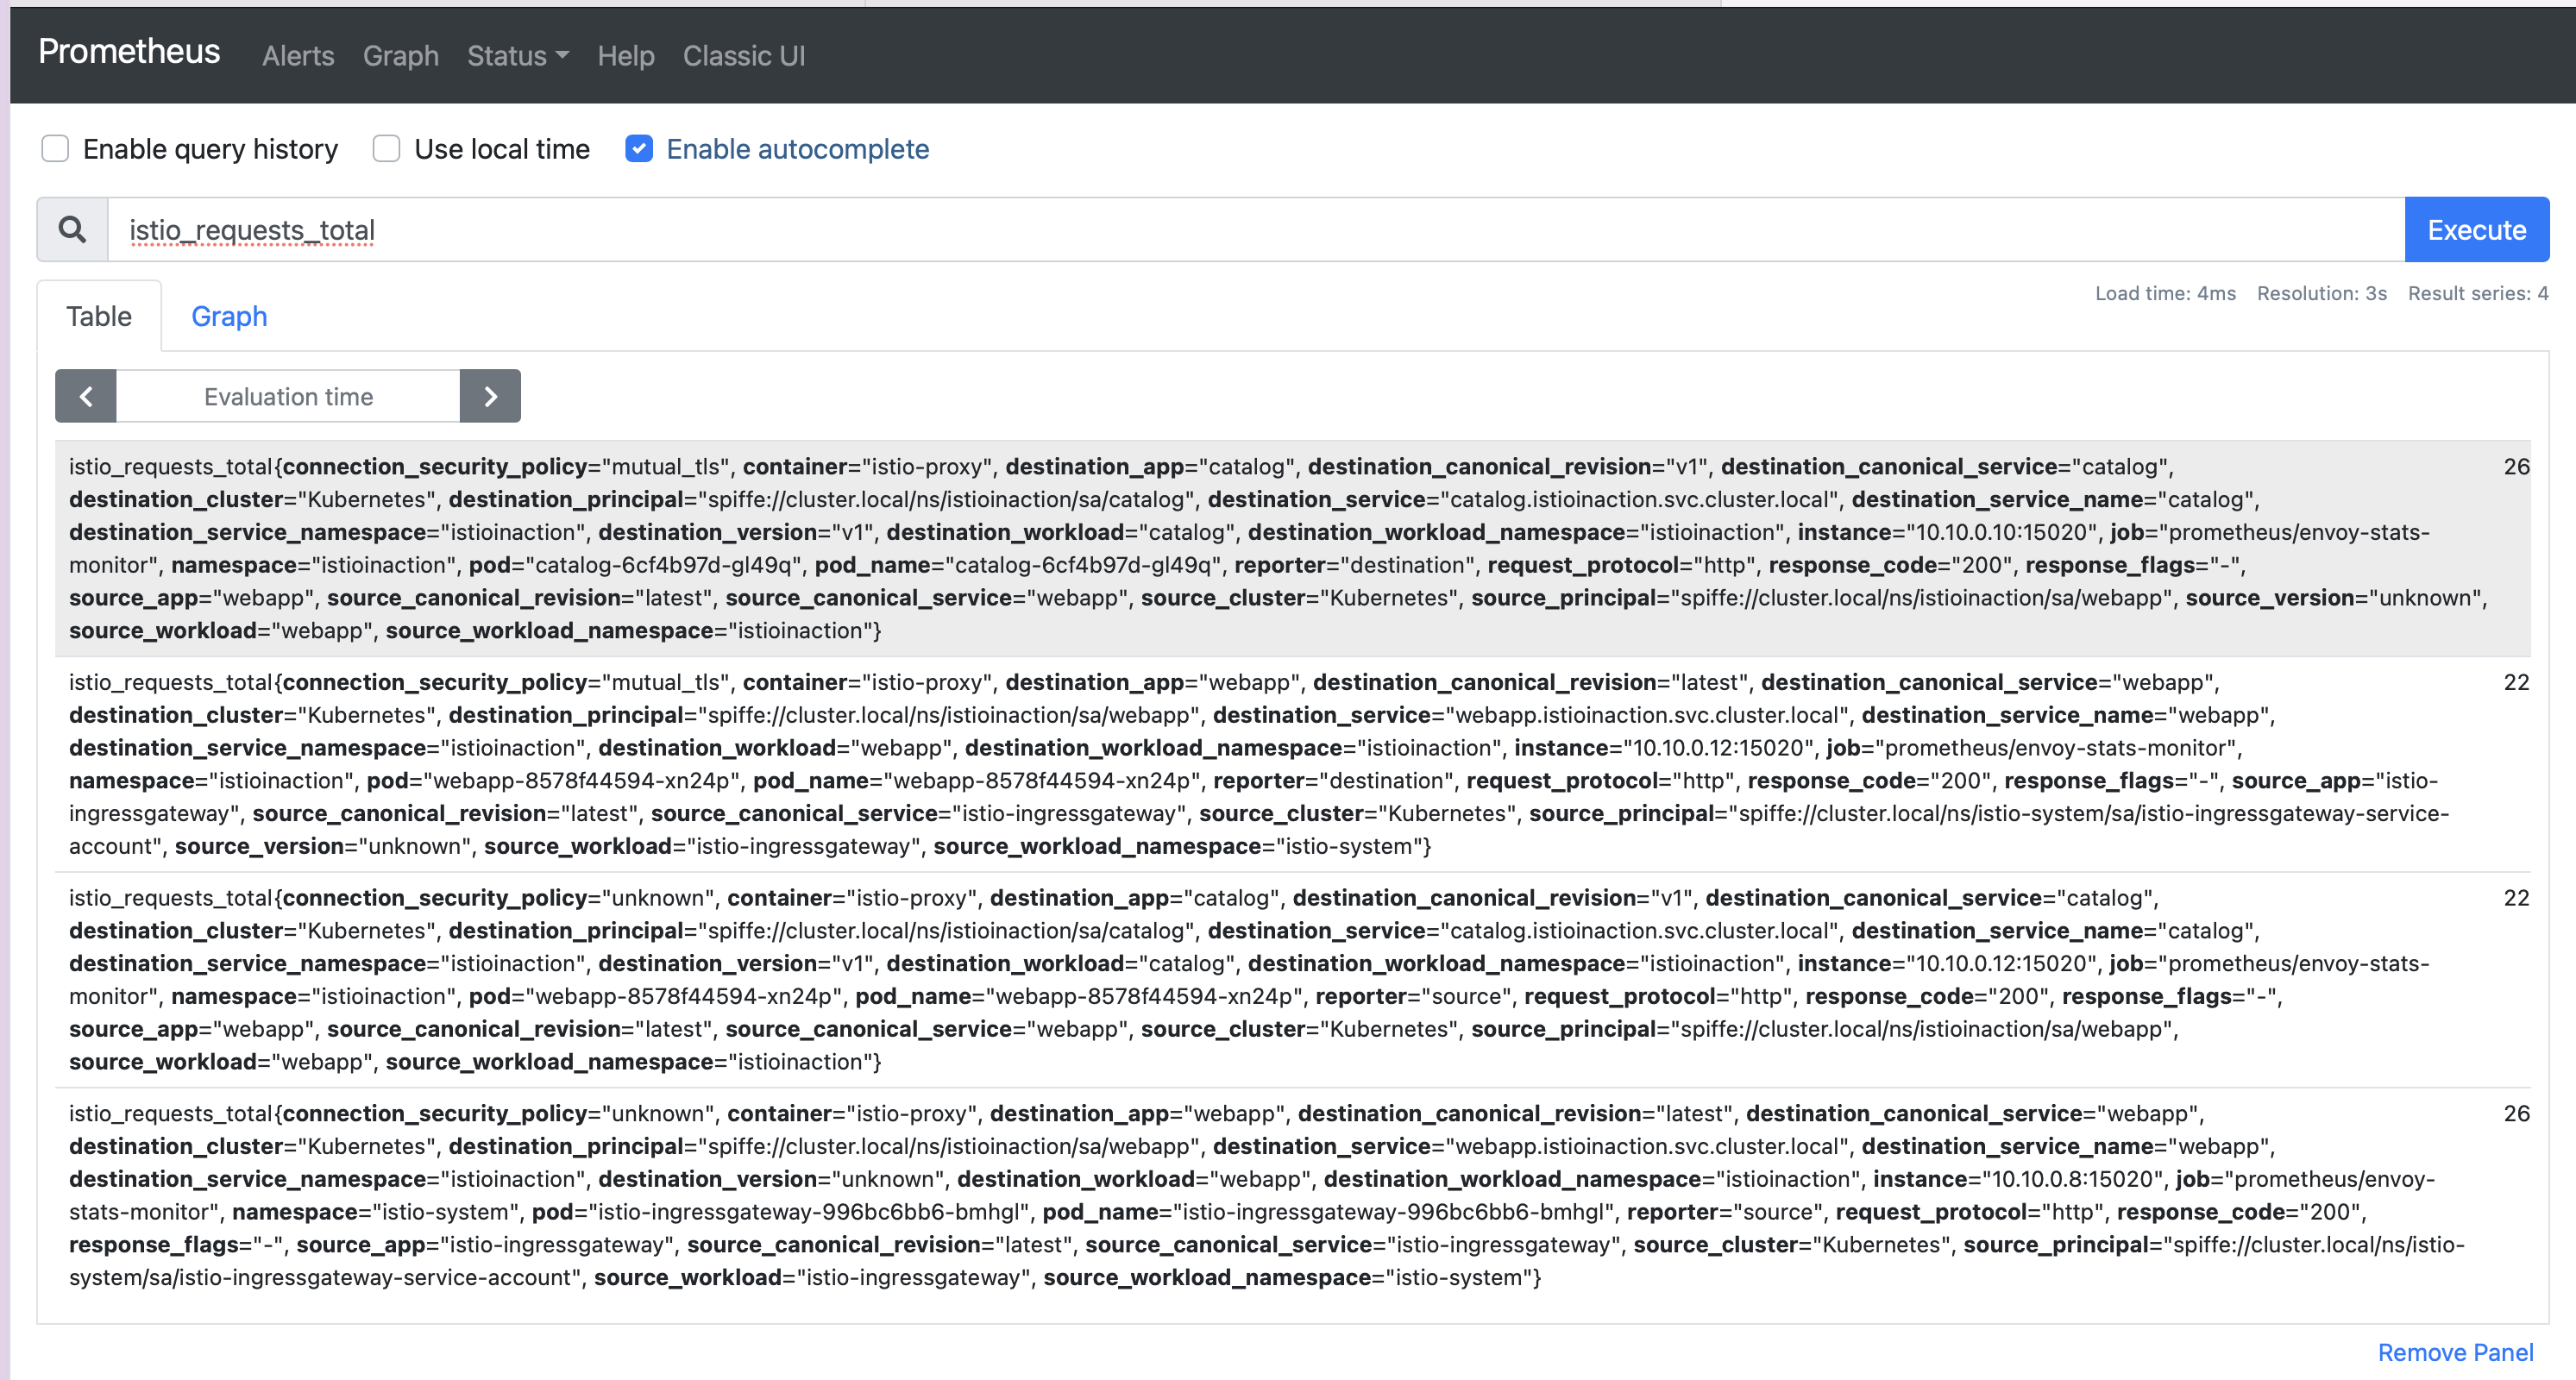
- PodMonitor 설정 적용, 프로메테우스 웹확인 (istio_request 쿼리문)
# pod-monitor-dp.yaml
apiVersion: monitoring.coreos.com/v1
kind: PodMonitor
metadata:
name: envoy-stats-monitor
namespace: prometheus
labels:
monitoring: istio-proxies
release: prom
spec:
selector:
matchExpressions:
- {key: istio-prometheus-ignore, operator: DoesNotExist}
namespaceSelector:
any: true
jobLabel: envoy-stats
podMetricsEndpoints:
- path: /stats/prometheus
interval: 15s
relabelings:
- action: keep
sourceLabels: [__meta_kubernetes_pod_container_name]
regex: "istio-proxy"
- action: keep
sourceLabels: [__meta_kubernetes_pod_annotationpresent_prometheus_io_scrape]
- sourceLabels: [
__address__, __meta_kubernetes_pod_annotation_prometheus_io_port]
action: replace
regex: ([^:]+)(?::\d+)?;(\d+)
replacement: $1:$2
targetLabel: __address__
- action: labeldrop
regex: "__meta_kubernetes_pod_label_(.+)"
- sourceLabels: [__meta_kubernetes_namespace]
action: replace
targetLabel: namespace
- sourceLabels: [__meta_kubernetes_pod_name]
action: replace
targetLabel: pod_name
# PodMonitor 설정 적용
kubectl apply -f ch7/pod-monitor-dp.yaml -n prometheus
#확인
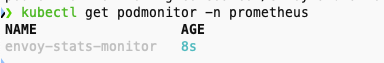
kubectl get podmonitor -n prometheus
# metric 확인을 위해서 호출테스트
for in in {1..10}; do curl -s http://webapp.istioinaction.io:30000/ ; sleep 0.5; done
for in in {1..10}; do curl -s http://webapp.istioinaction.io:30000/api/catalog ; sleep 0.5; done
# 메트릭 조회
WEBAPP=$(kubectl get pod -n istioinaction -l app=webapp -o jsonpath='{.items[0].status.podIP}')
kubectl exec -it netshoot -- curl -s $WEBAPP:15020/stats/prometheus
kubectl exec -it netshoot -- curl -s $WEBAPP:15090/stats/prometheus


4. 이스티오 표준 메트릭 커스텀마이징
엔보이 표준 메트릭 - 메트릭, 디멘션, 속성
- 엔보이 표준 메트릭
|
메트릭
|
설명
|
|
istio_requests_total
|
COUNTER, 요청이 들어올 때마다 증가
|
|
istio_request_duration_milliseconds
|
DISTRIBUTION, 요청 지속 시간이 분포
|
|
istio_request_bytes
|
DISTRIBUTION, 요청 바디 크기의 분포
|
|
istio_response_bytes
|
DISTRIBUTION, 응답 바디 크기의 분포
|
|
istio_request_messages_total
|
(gRPC) COUNTER, 클라이언트에게서 메시지가 올 때마다 증가
|
|
istio_response_messages_total
|
(gRPC) COUNTER, 서버가 메시지를 보낼 때마다 증가
|
- 이스티오 엔보이 프록시 사이드카에 몇 가지 플러그인을 사용해 메트릭이 표시, 커스터마이징, 생성되는 방법을 제어한다.
- 메트릭
- 서비스 호출(인바운드/아웃바운드) 간 텔레메트리의 카운터나 게이지, 히스토그램/분포를 말한다.
- 예: istio_requests_total 메트릭은 서비스로 향하는(인바운드) 혹은 서비스에서 나오는(아웃바운드) 요청의 총 개수를 센다.
- 서비스에 인바운드와 아웃바운드 요청이 모두 있다면 istio_request_total 메트릭에는 항목이 2개 표시된다.
- 디멘션
- 인바운드나 아웃바운드는 메트릭 디멘션의 예시다.
- 이스티도의 프록시에 통계를 쿼리할 때, 메트릭과 디멘션 조합마다 통계가 따로 표시된다.
- 방향만이 유일한 디멘션은 아니다. 메트릭에는 디멘션이 여럿일 수 있다.
- istio_requests_total 기본 디멘션
# TYPE istio_requests_total counter
istio_requests_total{
response_code="200", # 요청 세부 정보 Request details
reporter="destination", # 메트릭이 누구 관점인가? Point of view of metric
source_workload="istio-ingressgateway",
source_workload_namespace="istio-system",
source_app="istio-ingressgateway", # 호출 주제 Caller
source_version="unknown",
source_cluster="Kubernetes",
destination_workload="webapp",
destination_workload_namespace="istioinaction",
destination_app="webapp", # 호출 대상 Target of call
destination_version="unknown",
destination_service="webapp.istioinaction.svc.cluster.local",
destination_service_name="webapp",
destination_service_namespace="istioinaction",
destination_cluster="Kubernetes",
request_protocol="http",
response_flags="-",
grpc_response_status="",
connection_security_policy="mutual_tls",
source_canonical_service="istio-ingressgateway",
destination_canonical_service="webapp",
source_canonical_revision="latest",
destination_canonical_revision="latest"
} 6 # 호출 개수 Number of calls- 응답 코드가 HTTP 500인 경우 (간결함을 위해 일부 디멘션 생략)
- 디멘션 중 하나라도 다르면 이 메트릭의 새로운 항목으로 표시된다
- 디멘션이 다르면 istio_requests_total 에 대해 서로 다른 2개의 항목이 보인다. 여기서는 두 메트릭 간에 response_code 디멘션이 다르다.
istio_requests_total{
response_code="200", # HTTP 200 calls 호출
reporter="destination",
source_workload="istio-ingressgateway",
source_workload_namespace="istio-system",
destination_workload="webapp",
destination_workload_namespace="istioinaction",
request_protocol="http",
connection_security_policy="mutual_tls",
} 5 # Number of HTTP 200 calls 호출 개수

istio_requests_total{
response_code="500", # HTTP 500 calls 호출
reporter="destination",
source_workload="istio-ingressgateway",
source_workload_namespace="istio-system",
destination_workload="webapp",
destination_workload_namespace="istioinaction",
request_protocol="http",
connection_security_policy="mutual_tls",
} 3 # Number of HTTP 500 calls 호출 개수- 특정 메트릭에 대해 채우고 보고할 디멘션은 설정할 때 지정할 수 있다.
- 엔보이 프록시가 런타임에 갖고 있는 값인 속성에서 가져온다.
- 기본 엔보이 요청 속성
| 속성 | 설명 |
| request.path | URL 중 경로 부분 |
| request.url_parh | URL 중 경로 부분, 쿼리 문자열 제외 |
| request.host | URL 중 호스트 부분 |
| request.scheme | URL 중 스킴 부분(예: ‘http’) |
| request.headers | 요청 메서드 (예. ‘GET’) |
| request.referer | 요청 헤더 Referer |
| request.useragent | 요청 헤더 User agent |
| request.time | 첫 번째 바이트 수신 시간 |
| request.id | x-request-id 헤더 값에 해당하는 요청 ID |
| request.protocol | 요청 프로토콜 |
- 엔보이에서 사용할 수 있는 요청 속성일 뿐이다. 다른 속성도 있다.
- 응답 속성 Response attributes
- 커넥션 속성 Connection attributes
- 업스트림 속성 Upstream attributes
- 메타데이터/필터 상태 속성 Metadata/filter state attributes
- 웹어셈블리 속성 Wasm attributes
- 엔보이에서 기볹적으로 사용할 수 있는 속성은 공식 문서 참조
- 다른 속성 집합은 이스티오의 peer-metadata 필터(이스티오 프록시에 내장)에서 나오며, 서비스 호출의 upstream_peer와 downstream_peer 모두에서 사용할 수 있다.
- 메타데이터 교환 필터가 제공하는 이스티오 전용 속성
| 속성 | 설명 |
|
name
|
파드 이름
|
|
namespace
|
파드가 위치한 네임스페이스
|
|
labels
|
워크로드 레이블
|
|
owner
|
워크로드 소유자
|
|
workload_name
|
워크로드 이름
|
|
platform_metadata
|
접두사 키가 있는 플랫폼 메타데이터
|
|
istio_version
|
프록시의 버전 식별자
|
|
mesh_id
|
메시의 고유 식별자
|
|
cluster_id
|
해당 워크로드가 속한 클러스터의 식별자
|
|
app_containers
|
애플리케이션 컨테이너별 짧은 이름 목록
|
- 속성을 사용하려면 업스트림(프록시에서 나가는) 메트릭 -> upstream_peer , 다운스트림(프록시로 들어오는) 메트릭 ->downstream_peer 접두사로 붙이자
- 예: 서비스 호출자의 이스티오 프록시 버전을 보려면 downstream_peer.istio_version 사용
- 업스트림 서비스의 클러스터를 보려면 upstream_peer.cluster_id 를 사용
4.1 기존 메트릭 확인 및 (디멘션) 수정
- 기본적으로, 이스티오 메트릭은 이스티오를 설치할 때 설치되는 EnvoyFilter 리소스를 사용해 stats 프록시 플러그인에서 설정한다.
- stats 프록시 플러그인 분석
- 이 엔보이 필터는 istio.stats 라는 필터를 직접 구성한다.
- 이 필터는 통계(메트릭) 기능을 구현하는 웹어셈블리 플러그인이다. WebAssembly (Wasm) plugin.
- 이 웹어셈블리 필터는 실제로는 엔보이 코드베이스 내에서 직접 컴파일돼 NULL 가상머신에서 실행되므로, 웹어셈블리 가상머신에서 실행되지 않는다.
- 이를 웹어셈블리 가상머신에서 실행하려면 istioctl 로 설치할 때 -–setvalues.telemetry.v2.prometheus.wasmEnabled=true 플래그를 전달하거나 상응하는 IstioOperator 설정을 해야 한다.
# 메트릭 정보 수정 시 모든 버전의 envoyfilter 에 반영(업데이트)되는지 확인해보자.
kubectl get envoyfilter -n istio-system
NAME                    AGE
stats-filter-1.13       13h # 스터디 실습에서 사용
stats-filter-1.14       13h
stats-filter-1.15       13h
stats-filter-1.16       13h
stats-filter-1.17       13h # 현재 실습 istiod 버전
tcp-stats-filter-1.13   13h
tcp-stats-filter-1.14   13h
tcp-stats-filter-1.15   13h
tcp-stats-filter-1.16   13h
tcp-stats-filter-1.17   13h

#
kubectl get envoyfilter stats-filter-1.13 -n istio-system -o yaml
...
spec:
  configPatches:
  - applyTo: HTTP_FILTER
    match:
      context: SIDECAR_OUTBOUND
      listener:
        filterChain:
          filter:
            name: envoy.filters.network.http_connection_manager
            subFilter:
              name: envoy.filters.http.router
      proxy:
        proxyVersion: ^1\.13.*
    patch:
      operation: INSERT_BEFORE
      value:
        name: istio.stats # 필터 이름
        typed_config:
          '@type': type.googleapis.com/udpa.type.v1.TypedStruct
          type_url: type.googleapis.com/envoy.extensions.filters.http.wasm.v3.Wasm
          value:
            config: # 필터 설정
              configuration:
                '@type': type.googleapis.com/google.protobuf.StringValue
                value: |
                  {
                    "debug": "false",
                    "stat_prefix": "istio"
                  }
              root_id: stats_outbound
              vm_config:
                code:
                  local:
                    inline_string: envoy.wasm.stats
                runtime: envoy.wasm.runtime.null
                vm_id: stats_outbound
...
기존 메트릭에 디멘션 추가하기
- 요구사항
- istio_request_total 메트릭에 디멘션을 2개 추가하고 싶다고 해보자.
- 아마 추적을 강화하려는 목적으로, 업스트림 호출에서 meshId 별로 프록시의 버전이 어떤지 확인하고 싶을 수 있다.
- upstream_proxy_version 및 source_mesh_id 디멘션을 추가해보자. (추적하고 싶지 않거나 원하는 것보다 많은 정보를 생성하는 기존 디멘션을 제거할 수도 있다)
- requests_total 메트릭(istio_ 접두사를 자동 추가로 붙이지 않은 점 확인)을 특정해 속성에서 오는 디멘션 둘이 새로 포함되도록 설정하고 있다.
- request_protocol 디멘션을 제거하기도 한다.
- 기존 설정 확인, 프로메테우스 UI 확인 (istio_requests_total)
kubectl get istiooperator installed-state -n istio-system -o yaml | grep -E "prometheus:|telemetry:" -A2

# 메트릭 확인 : request_protocol 디멘션이 메트릭에 있는지 먼저 확인 >> 아래 설정 적용 후에 확인 시 해당 디멘션 없이 출력됨.
kubectl -n istioinaction exec -it deploy/webapp -c istio-proxy \
-- curl localhost:15000/stats/prometheus | grep istio_requests_total

- 설정 적용
- 이스티오 1.17 이하 버전 에서는 다음 사항을 지켜야 한다.
- 메트릭에서 이 디멘션을 확인하기 전에 이스티오의 프록시가 이 디멘션에 대해 알게 해야 한다.
- 이렇게 하려면 디플로이먼트 파드 Spec에 sidecar.istio.io/extraStatTags 애노테이션을 달아야 한다.
- 이 애노테이션은 디폴이먼트 메타데이터가 아니라 spec.template.metadata 파드 템플릿에 추가돼야 한다는 점을 유의하자.
- istio 1.17+ 부터 custom dimension 에 대한 annotation (extraStatTags) 설정이 필요없어짐. - Docs
- 이스티오 1.17 이하 버전 에서는 다음 사항을 지켜야 한다.
# 설정 적용
docker exec -it myk8s-control-plane bash
----------------------------------------
# 파일 작성
cat << EOF > istio-operator-new-dimensions.yaml
apiVersion: install.istio.io/v1alpha1
kind: IstioOperator
spec:
profile: demo
values:
telemetry:
v2:
prometheus:
configOverride:
inboundSidecar:
metrics:
- name: requests_total
dimensions:
upstream_proxy_version: upstream_peer.istio_version
source_mesh_id: node.metadata['MESH_ID']
tags_to_remove:
- request_protocol
outboundSidecar:
metrics:
- name: requests_total
dimensions:
upstream_proxy_version: upstream_peer.istio_version
source_mesh_id: node.metadata['MESH_ID']
tags_to_remove:
- request_protocol
gateway:
metrics:
- name: requests_total
dimensions:
upstream_proxy_version: upstream_peer.istio_version
source_mesh_id: node.metadata['MESH_ID']
tags_to_remove:
- request_protocol
EOF
istioctl verify-install -f istio-operator-new-dimensions.yaml # 리소스별로 적용결과를 출력
istioctl install -f istio-operator-new-dimensions.yaml -y
exit
----------------------------------------
# 변경 설정 확인
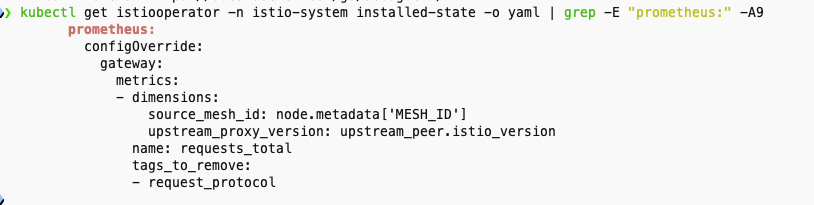
kubectl get istiooperator -n istio-system installed-state -o yaml | grep -E "prometheus:" -A9
# envoyfilter "stats-filter-{stat-postfix}"도 업데이트 확인
kubectl get envoyfilter stats-filter-1.13 -n istio-system -o yaml

- 서비스에 적용 , 프로메테우스 UI 에서 확인 - istio_requests_total
# webapp-deployment-extrastats.yaml
---
apiVersion: apps/v1
kind: Deployment
metadata:
  labels:
    app: webapp
  name: webapp
spec:
  replicas: 1
  selector:
    matchLabels:
      app: webapp
  template:
    metadata:
      annotations:
        proxy.istio.io/config: |-
          extraStatTags:
          - "upstream_proxy_version"
          - "source_mesh_id"
      labels:
        app: webapp
    spec:
      containers:
      - env:
        - name: KUBERNETES_NAMESPACE
          valueFrom:
            fieldRef:
              fieldPath: metadata.namespace
        image: istioinaction/webapp:latest
        imagePullPolicy: IfNotPresent
        name: webapp
        ports:
        - containerPort: 8080
          name: http
          protocol: TCP
        securityContext:
          privileged: false

# 적용
kubectl apply -n istioinaction -f ch7/metrics/webapp-deployment-extrastats.yaml

# metric 확인을 위해서 호출테스트
for in in {1..10}; do curl -s http://webapp.istioinaction.io:30000/api/catalog ; sleep 0.5; done


# 메트릭 확인 : request_protocol 디멘션이 디멘션 목록에 없는 것도 확인
kubectl -n istioinaction exec -it deploy/webapp -c istio-proxy \
-- curl localhost:15000/stats/prometheus | grep istio_requests_total


4.2 새로운 메트릭 만들기
- 새로운 메트릭을 만들려면 stats 플러그인에 정의하면 된다.
- 새로운 메트릭 만들기위한 코드 -istio-operator-new-metric 분석
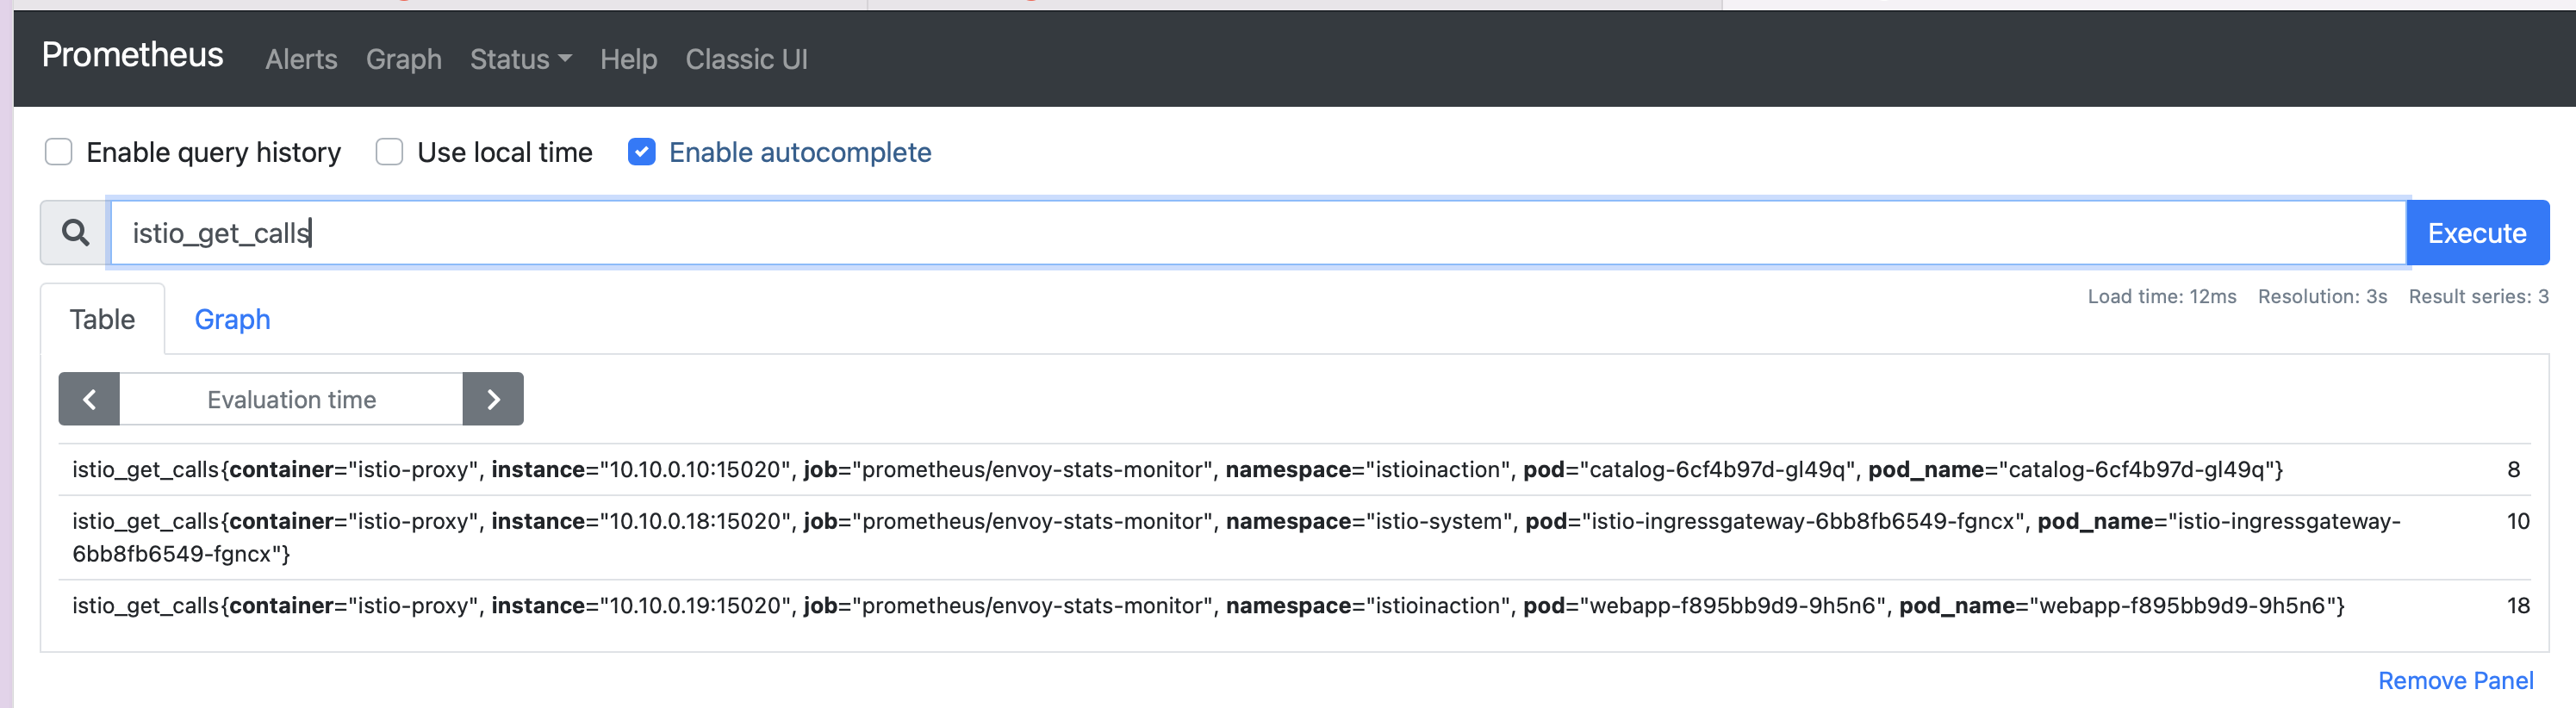
- 새로운 메트릭 이름은 istio_get_calls 인데, 정의한 이름은 get_calls 라는 점을 유의하자. 앞서 언급했듯이 istio_ 접두사는 자동으로 붙는다.
- 이 메트릭을 COUNTER로 정의했지만 GAUGE 나 HISTOGRAM도 선택할 수 있다. 메트릭의 값은 CELCommon Expression Language 표현식인 문자열로, COUNTER 타입에 정수를 반환해야 한다. https://github.com/google/cel-spec
- CEL 표현식은 속성에 대해 작동하여, 여기서는 HTTP GET 요청 개수를 센다.
# istio-operator-new-metric.yaml
apiVersion: install.istio.io/v1alpha1
kind: IstioOperator
spec:
  profile: demo
  values:
    telemetry:
      v2:
        prometheus:
          configOverride:
            inboundSidecar:
              definitions:
              - name: get_calls
                type: COUNTER
                value: "(request.method.startsWith('GET') ? 1 : 0)"
            outboundSidecar:
              definitions:
              - name: get_calls
                type: COUNTER
                value: "(request.method.startsWith('GET') ? 1 : 0)"
            gateway:
              definitions:
              - name: get_calls
                type: COUNTER
                value: "(request.method.startsWith('GET') ? 1 : 0)"
- 설정 적용 , 프로메테우스 UI 확인 -istio_get_calls
# 설정 적용
docker exec -it myk8s-control-plane bash
----------------------------------------
cat << EOF > istio-operator-new-metric.yaml
apiVersion: install.istio.io/v1alpha1
kind: IstioOperator
spec:
  profile: demo
  values:
    telemetry:
      v2:
        prometheus:
          configOverride:
            inboundSidecar:
              definitions:
              - name: get_calls
                type: COUNTER
                value: "(request.method.startsWith('GET') ? 1 : 0)"
            outboundSidecar:
              definitions:
              - name: get_calls
                type: COUNTER
                value: "(request.method.startsWith('GET') ? 1 : 0)"
            gateway:
              definitions:
              - name: get_calls
                type: COUNTER
                value: "(request.method.startsWith('GET') ? 1 : 0)"
EOF

istioctl verify-install -f istio-operator-new-metric.yaml # 리소스별로 적용결과를 출력
istioctl install -f istio-operator-new-metric.yaml -y

exit


# 확인
kubectl get istiooperator -n istio-system installed-state -o yaml  | grep -A2 get_calls$


# metric 확인을 위해서 호출테스트
for in in {1..10}; do curl -s http://webapp.istioinaction.io:30000/api/catalog ; sleep 0.5; done

# 메트릭 확인
kubectl -n istioinaction exec -it deploy/webapp -c istio-proxy -- curl localhost:15000/stats/prometheus | grep istio_get_calls


- 새로운 디멘션과 속성을 만들어 더 세분화할 수 있다.
4.3 새 속성으로 호출 그룹화하기
- 기존 속성을 기반으로 더 세분화하거나 도메인에 특화해 새 속성을 만들 수 있다.
- 예를 들어 istio_operationId 라는 새 속성을 만들 수 있다.
- 이 속성은 request.path_url 과 request.method 를 조합해 catalog 서비스의 /items API로 가는 GET 호출 개수를 추적하려는 것이다.
- 이를 위해 이스티오 attribute-gen 프록시 플러그인을 사용하는데, 이 플러그인은 프록시 메트릭의 동작을 개조하는 데 사용하는 또 다른 웹어셈블리 Wasm extension 확장이다.
- attribute-gen 플러그인은 앞 절에서 사용했던 stats 플러그인을 보완하는 역할을 한다.
- attribute-gen 플러그인은 stats 플러그인 보다 먼저 적용되기 때문에 이 플러그인이 만들어내는 모든 속성을 stats 에서 사용할 수 있다.
- EnvoyFilter 리소스로 attribute-gen 플러그인 구성 코드 분석
- 기본 속성 몇 가지를 조합해서 특정 종류의 호출을 식별할 수 있는 istio_operationId 라는 새 속성을 만들어낸다.
- 여기서는 /items 라는 특정 API 로의 호출을 식별한 후 세려고 한다.
- attribute-gen 플러그인을 webapp 서비스의 아웃바운드 호출에 추가해 catalog 서비스의 /items 로 향햐는 호출을 추적한다.
# attribute-gen.yaml
apiVersion: networking.istio.io/v1alpha3
kind: EnvoyFilter
metadata:
  name: attribute-gen-example
  namespace: istioinaction
spec:
  configPatches:
  ## Sidecar Outbound
  - applyTo: HTTP_FILTER
    match:
      context: SIDECAR_OUTBOUND
      listener:
        filterChain:
          filter:
            name: envoy.filters.network.http_connection_manager
            subFilter:
              name: istio.stats
      proxy:
        proxyVersion: ^1\.13.*
    patch:
      operation: INSERT_BEFORE
      value:
        name: istio.attributegen
        typed_config:
          '@type': type.googleapis.com/udpa.type.v1.TypedStruct
          type_url: type.googleapis.com/envoy.extensions.filters.http.wasm.v3.Wasm
          value:
            config:
              configuration:
                '@type': type.googleapis.com/google.protobuf.StringValue
                value: |
                  {
                    "attributes": [
                      {
                        "output_attribute": "istio_operationId", # 속성 이름
                        "match": [
                         {
                           "value": "getitems", # 속성 값
                           "condition": "request.url_path == '/items' && request.method == 'GET'"
                         },
                         {
                           "value": "createitem",
                           "condition": "request.url_path == '/items' && request.method == 'POST'"
                         },
                         {
                           "value": "deleteitem",
                           "condition": "request.url_path == '/items' && request.method == 'DELETE'"
                         }
                       ]
                      }
                    ]
                  }
              vm_config:
                code:
                  local:
                    inline_string: envoy.wasm.attributegen
runtime: envoy.wasm.runtime.null- attribute-gen.yaml 을 적용 테스트 후 프로메테우스 UI로 확인 (istio_requests_total{upstream_operation!=""},istio_requests_total)
- proxyVersion: ^1\.16.* 을 설치된 istio 버전에 맞게 1.16 혹은 1.17 로 수정 해야 한다
- catalog 에 대한 API 호출을 식별하기 위해 istio_request_total 메트릭 안에 이 속성을 사용하는 새 디멘션 upstream_operator 을 추가 한다
# 설정 적용
docker exec -it myk8s-control-plane bash
----------------------------------------
cat << EOF > istio-operator-new-attribute.yaml
apiVersion: install.istio.io/v1alpha1
kind: IstioOperator
spec:
  profile: demo
  values:
    telemetry:
      v2:
        prometheus:
          configOverride:
            outboundSidecar:
              metrics:
              - name: requests_total
                dimensions:
                  upstream_operation: istio_operationId # 새 디멘션
EOF
istioctl verify-install -f istio-operator-new-attribute.yaml # 리소스별로 적용결과를 출력
istioctl install -f istio-operator-new-attribute.yaml -y

exit
----------------------------------------

# 확인 : outboundSidecar 에만 적용됨
kubectl get istiooperator -n istio-system installed-state -o yaml | grep -B2 -A1 istio_operationId$

# metric 확인을 위해서 호출테스트
for in in {1..10}; do curl -s http://webapp.istioinaction.io:30000/api/catalog ; sleep 0.5; done

# 메트릭 확인 : dimension (upstream_operation) 추가 확인!
kubectl -n istioinaction exec -it deploy/webapp -c istio-proxy -- curl localhost:15000/stats/prometheus | grep istio_requests_total


- 애플리케이션 간에 네트워크를 통한 통신이 늘어날수록 문제가 발생할 가능성이 더 높아진다는 것을 알아야 한다.
- 누가 애플리케이션을 작성했든, 무슨 언어를 사용했든 상관없이 서비스 간에 무슨 일이 일어나고 있는지에 한결같은 시야를 갖는 것은 마이크로서비스 스타일 아키텍처를 운영하는 데 필수 조건이나 마찬가지다.
- 이스티오는 서비스 간 메트릭 수집을 더 쉽게 만드는데, 개발자가 애플리케이션에 명시적으로 코딩하지 않아도 성공률, 실패율, 재시도 횟수, 지연 시간 등을 관찰하기 때문이다.
- 이들은 분명히 필요하며, 이스티오는 다만 황금 신호 네트워크 메트릭 수집을 간편하게 만들 뿐이다. (구글 SRE 책은 지연 시간, 처리량, 오류, 포화도를 황금 신호 메트릭으로 지칭한다)
- https://sre.google/sre-book/monitoring-distributed-systems/
- golden-signal metrics: latency, throughput, errors, and saturation.
정리
- 모니터링은 알려진 바람직하지 않은 상태를 관찰하기 위해 메트릭를 수집하고 집계하여 수정 조치를 취할 수 있도록 하는 과정입니다.
- Monitoring is the process of collecting and aggregating metrics to watch for known undesirable states so that corrective measures can be taken.
- Istio는 사이드카 프록시에서 요청을 가로챌 때 모니터링에 사용되는 메트릭을 수집합니다. 프록시는 7계층(애플리케이션 네트워킹 계층)에서 작동하기 때문에 메트릭에 사용할 수 있는 상태 코드, HTTP 메서드, 헤더 등 다양한 정보에 액세스할 수 있습니다.
- Istio collects the metrics used for monitoring when intercepting requests in the sidecar proxy. Because the proxy acts at layer 7 (the application-networking layer), it has access to a great deal of information such as status codes, HTTP methods, and headers that can be used in metrics.
- 핵심 지표 중 하나는 istio_requests_total로, 요청을 카운트하고 상태 코드 200으로 끝나는 요청 수와 같은 질문에 답합니다.
- One of the key metrics is istio_requests_total, which counts requests and answers questions such as how many requests ended with status code 200.
- 프록시에 의해 노출된 지표는 관측 가능한 시스템을 구축하는 기초를 마련합니다.
- The metrics exposed by the proxies set the foundation to build an observable system.
- 메트릭 수집 시스템은 프록시에서 노출된 메트릭을 수집하고 집계합니다.
- Metrics-collection systems collect and aggregate the exposed metrics from the proxies.
- 기본적으로 Istio는 프록시가 제한된 통계 집합만 표시하도록 구성합니다. meshConfig .defaultConfig를 사용하거나 주석 proxy.istio .io/config를 사용하여 워크로드 단위로 더 많은 메쉬 전체를 보고하도록 프록시를 구성할 수 있습니다.
- By default, Istio configures the proxies to expose only a limited set of statistics. You can configure the proxies to report more mesh-wide using the meshConfig .defaultConfig or on a per-workload basis using the annotation proxy.istio .io/config.
- 컨트롤 플레인에는 성능에 대한 지표도 표시됩니다. 가장 중요한 것은 프록시에 변경 사항을 배포하는 데 걸리는 시간을 측정하는 히스토그램 파일럿_proxy_convergence_time입니다.
- The control plane also exposes metrics for its performance. The most important is the histogram pilot_proxy_convergence_time, which measures the time taken to distribute changes to the proxies.
- IstioOperator를 사용하여 Istio에서 사용할 수 있는 메트릭을 사용자 지정하고 프록시 구성을 정의하는 주석 proxy.istio.io/config 에서 extraStats 값을 설정하여 서비스에 사용할 수 있습니다. 이러한 수준의 제어는 운영자(최종 사용자)가 스크래핑되는 원격 측정과 대시보드에 표시하는 방법에 대한 유연성을 제공합니다.
- We can customize the metrics available in Istio using the IstioOperator and use them in services by setting the extraStats value in the annotation proxy.istio.io/config that defines the proxy configuration. This level of control gives the operator (end user) flexibility over what telemetry gets scraped and how to present it in dashboards.
'Istio Hands-on Study [1기]' 카테고리의 다른 글
| [5주차] 마이크로서비스 통신 보안 개념 정리 및 실습 (0) | 2025.05.08 |
|---|---|
| [4주차]Observability-Visualizing network behavior with Grafana, Jaeger, and Kiali 개념 정리 및 실습 (0) | 2025.05.03 |
| [3주차]Traffic control,Resilience - Traffic control 개념정리 및 실습 (0) | 2025.04.26 |
| [3주차]Traffic control, Resilience - Resilience 개념정리 및 실습 (0) | 2025.04.26 |
| [2주차] Envoy, Isto Gateway - Istio gateways 개념 정리 및 실습 (0) | 2025.04.20 |
📚 목차 보기